Estimated Value: $138,000 - $160,510
3
Beds
1
Bath
912
Sq Ft
$164/Sq Ft
Est. Value
About This Home
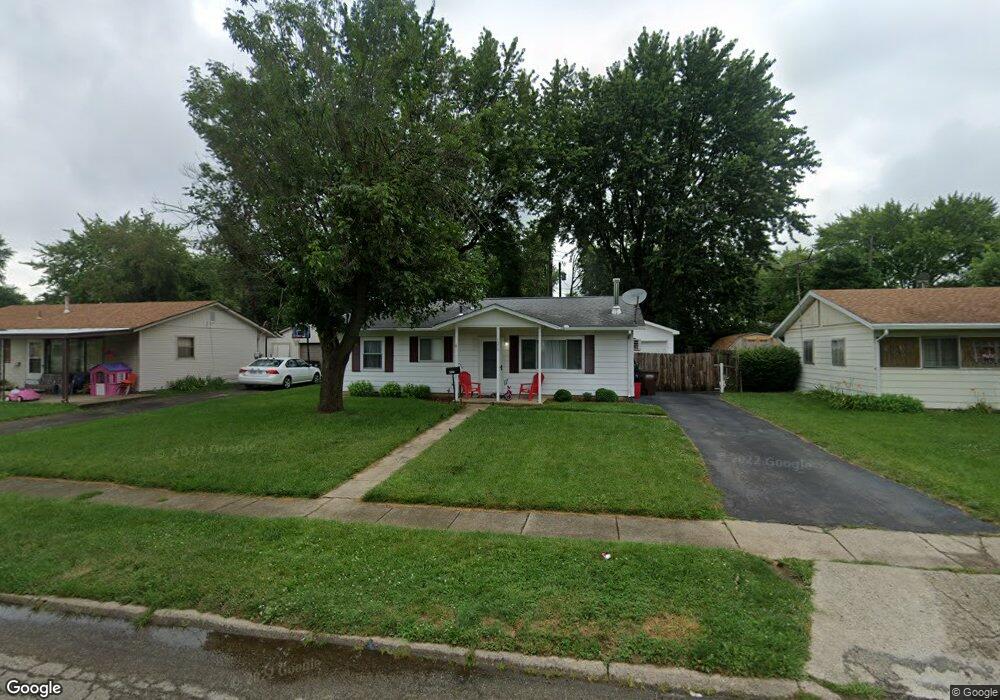
This home is located at 1258 Reid Ave, Xenia, OH 45385 and is currently estimated at $149,378, approximately $163 per square foot. 1258 Reid Ave is a home located in Greene County with nearby schools including Xenia High School, Summit Academy Community School for Alternative Learners - Xenia, and Legacy Christian Academy.
Ownership History
Date
Name
Owned For
Owner Type
Purchase Details
Closed on
Oct 6, 2021
Sold by
Cordle Ethan G and Cordle Jayeanne E
Bought by
Turnbull Property Holdings Nevada Llc
Current Estimated Value
Purchase Details
Closed on
Jul 19, 2019
Sold by
Sheffs Tammy and Sheffs Robert J
Bought by
Cordle Ethan G and Cordle Jayeanna E
Home Financials for this Owner
Home Financials are based on the most recent Mortgage that was taken out on this home.
Original Mortgage
$91,424
Interest Rate
3.73%
Mortgage Type
VA
Purchase Details
Closed on
Jun 23, 2017
Sold by
Dabe Louella J and Myers Louella J
Bought by
Sheffs Tammy
Purchase Details
Closed on
Dec 5, 2002
Sold by
Myers William M
Bought by
Dabe Louella J and Myers Louella J
Create a Home Valuation Report for This Property
The Home Valuation Report is an in-depth analysis detailing your home's value as well as a comparison with similar homes in the area
Home Values in the Area
Average Home Value in this Area
Purchase History
| Date | Buyer | Sale Price | Title Company |
|---|---|---|---|
| Turnbull Property Holdings Nevada Llc | $102,000 | None Available | |
| Cordle Ethan G | $89,500 | Vantage Land Title | |
| Sheffs Tammy | $48,500 | First Ohio Title | |
| Dabe Louella J | -- | -- |
Source: Public Records
Mortgage History
| Date | Status | Borrower | Loan Amount |
|---|---|---|---|
| Previous Owner | Cordle Ethan G | $91,424 |
Source: Public Records
Tax History Compared to Growth
Tax History
| Year | Tax Paid | Tax Assessment Tax Assessment Total Assessment is a certain percentage of the fair market value that is determined by local assessors to be the total taxable value of land and additions on the property. | Land | Improvement |
|---|---|---|---|---|
| 2024 | $1,781 | $41,620 | $8,070 | $33,550 |
| 2023 | $1,781 | $41,620 | $8,070 | $33,550 |
| 2022 | $1,478 | $29,470 | $5,760 | $23,710 |
| 2021 | $1,329 | $26,140 | $5,760 | $20,380 |
| 2020 | $1,273 | $26,140 | $5,760 | $20,380 |
| 2019 | $1,161 | $22,430 | $4,290 | $18,140 |
| 2018 | $1,165 | $22,430 | $4,290 | $18,140 |
| 2017 | $1,084 | $22,430 | $4,290 | $18,140 |
| 2016 | $1,084 | $21,040 | $4,290 | $16,750 |
| 2015 | $1,087 | $21,040 | $4,290 | $16,750 |
| 2014 | $1,040 | $21,040 | $4,290 | $16,750 |
Source: Public Records
Map
Nearby Homes
- 1283 June Dr
- 1233 June Dr
- 1223 June Dr
- 1391 June Dr
- 1342 Kylemore Dr
- 343 Sheelin Rd
- 1351 Omard Dr
- 912 Omard Dr
- 883 Omard Dr
- 1144 Rockwell Dr
- 509 Antrim Rd
- 121 S Progress Dr
- 305-325 Bellbrook Ave
- 1568 Cheyenne Dr
- 1208 Bellbrook Ave
- 453 Walnut St
- 1272 Bellbrook Ave
- 1618 Navajo Dr
- 613 N West St
- 137 Pleasant St