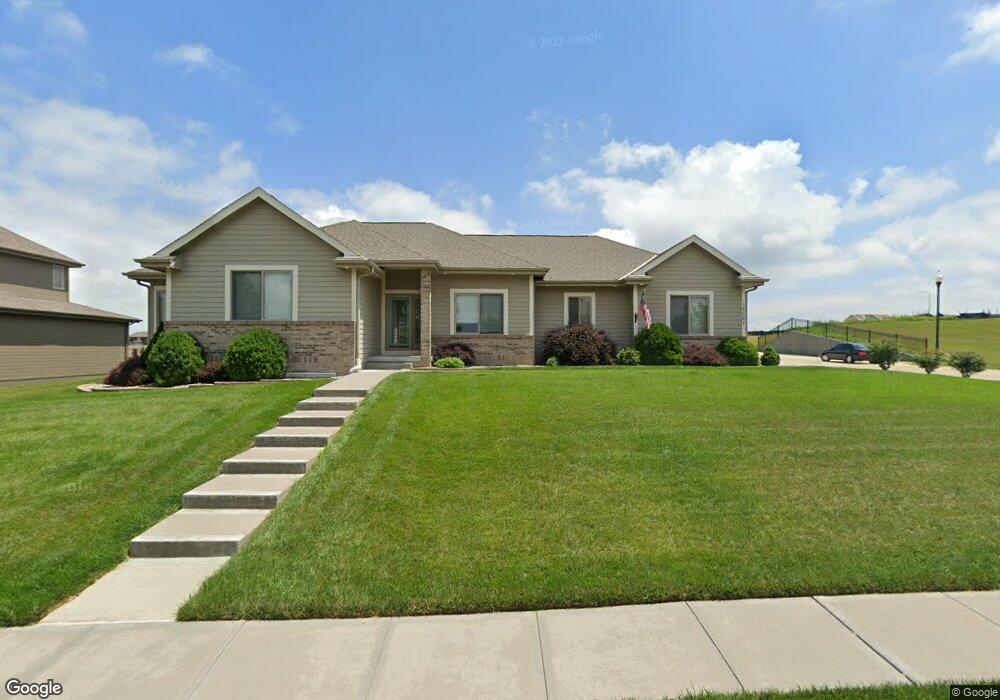
12587 S 79th Ave Papillion, NE 68046
Estimated Value: $541,000 - $858,000
3
Beds
2
Baths
2,017
Sq Ft
$326/Sq Ft
Est. Value
About This Home
This home is located at 12587 S 79th Ave, Papillion, NE 68046 and is currently estimated at $658,024, approximately $326 per square foot. 12587 S 79th Ave is a home located in Sarpy County with nearby schools including Bell Elementary School, Papillion Middle School, and Papillion La Vista South High School.
Ownership History
Date
Name
Owned For
Owner Type
Purchase Details
Closed on
Jun 10, 2009
Sold by
Ideal Designs Remodeling & Construction
Bought by
Johnson Ricky L and Johnson Elisabeth A
Current Estimated Value
Home Financials for this Owner
Home Financials are based on the most recent Mortgage that was taken out on this home.
Original Mortgage
$304,000
Outstanding Balance
$191,345
Interest Rate
4.7%
Estimated Equity
$466,679
Create a Home Valuation Report for This Property
The Home Valuation Report is an in-depth analysis detailing your home's value as well as a comparison with similar homes in the area
Home Values in the Area
Average Home Value in this Area
Purchase History
| Date | Buyer | Sale Price | Title Company |
|---|---|---|---|
| Johnson Ricky L | $449,000 | Ot |
Source: Public Records
Mortgage History
| Date | Status | Borrower | Loan Amount |
|---|---|---|---|
| Open | Johnson Ricky L | $304,000 |
Source: Public Records
Tax History Compared to Growth
Tax History
| Year | Tax Paid | Tax Assessment Tax Assessment Total Assessment is a certain percentage of the fair market value that is determined by local assessors to be the total taxable value of land and additions on the property. | Land | Improvement |
|---|---|---|---|---|
| 2025 | $9,295 | $538,020 | $70,000 | $468,020 |
| 2024 | $10,213 | $526,454 | $65,000 | $461,454 |
| 2023 | $10,213 | $475,144 | $59,500 | $415,644 |
| 2022 | $10,191 | $433,864 | $59,500 | $374,364 |
| 2021 | $10,354 | $409,448 | $52,000 | $357,448 |
| 2020 | $10,280 | $403,848 | $52,000 | $351,848 |
| 2019 | $10,274 | $393,534 | $50,000 | $343,534 |
| 2018 | $10,218 | $390,217 | $50,000 | $340,217 |
| 2017 | $10,236 | $391,276 | $50,000 | $341,276 |
| 2016 | $10,033 | $383,216 | $50,000 | $333,216 |
| 2015 | $10,231 | $391,218 | $50,000 | $341,218 |
| 2014 | $10,089 | $384,650 | $50,000 | $334,650 |
| 2012 | -- | $381,790 | $48,000 | $333,790 |
Source: Public Records
Map
Nearby Homes
- 12613 S 79 St
- 12616 S 78th Ave
- 12620 S 78th Ave
- 12715 S 79th St
- 8702 Reed St Unit Lot 60
- 8616 Reed St Unit Lot 61
- 8804 Reed St Unit Lot 58
- 8808 Reed St Unit Lot 57
- 8902 Reed St Unit Lot 56
- 8906 Reed St Unit Lot 55
- 12717 S 77th St
- 12605 S 75th St
- 2415 Corn Dr
- 2405 Laura Cir
- 2209 Corn Dr
- 12375 S 74th St
- 7264 Von St
- 7320 Leawood Cir
- 12703 S 73rd St
- Lot 65 Shadow Creek
- 12579 S 79th Ave
- 12603 S 79th Ave
- 12586 S 79th Ave
- 12578 S 79th Ave
- 12571 S 79th Ave
- 7904 Von St
- 12602 S 79th Ave
- 12611 S 79th Ave
- 7864 Von St
- 12610 S 79th Ave
- 12563 S 79th Ave
- 12559 S 80th St
- 12619 S 79th Ave
- 12567 S 80th St
- 12554 S 79th Ave
- 12607 S 80th St
- 7860 Von St
- 12614 S 79th St
- 12551 S 80th St
- 12618 S 79th Ave