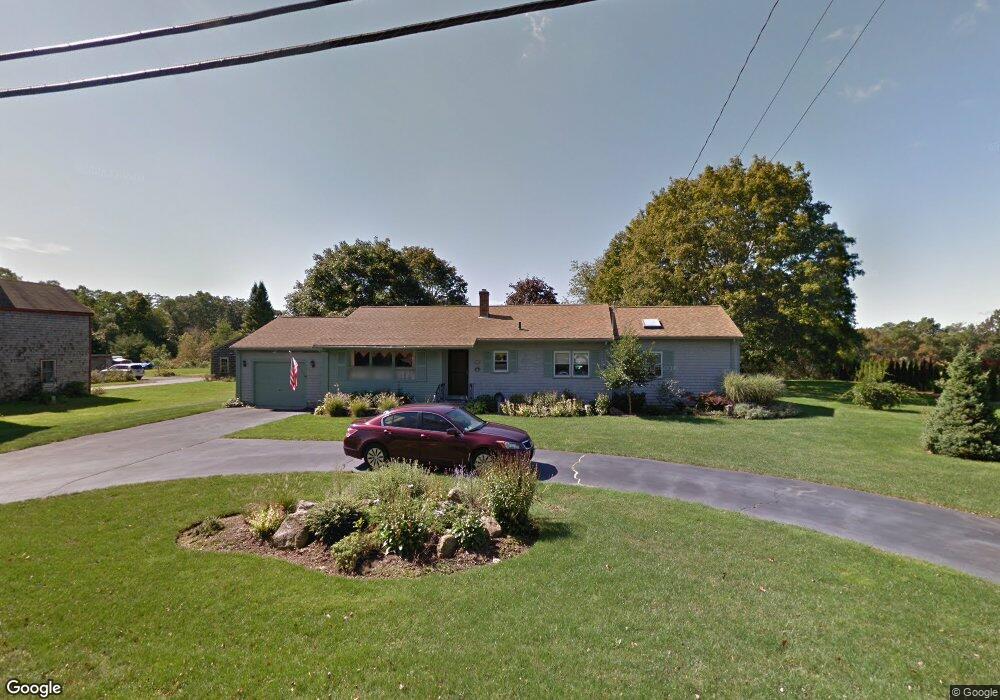
1259 Main St Acushnet, MA 02743
Estimated Value: $551,367 - $690,000
3
Beds
2
Baths
2,126
Sq Ft
$302/Sq Ft
Est. Value
About This Home
This home is located at 1259 Main St, Acushnet, MA 02743 and is currently estimated at $642,342, approximately $302 per square foot. 1259 Main St is a home located in Bristol County with nearby schools including Acushnet Elementary School, Albert F Ford Middle School, and St Francis Xavier Elementary School.
Ownership History
Date
Name
Owned For
Owner Type
Purchase Details
Closed on
Dec 7, 2001
Sold by
Trahan Kevin R
Bought by
Feinman Alex and Feinman Joyce
Current Estimated Value
Home Financials for this Owner
Home Financials are based on the most recent Mortgage that was taken out on this home.
Original Mortgage
$275,500
Outstanding Balance
$108,451
Interest Rate
6.67%
Mortgage Type
Purchase Money Mortgage
Estimated Equity
$533,891
Create a Home Valuation Report for This Property
The Home Valuation Report is an in-depth analysis detailing your home's value as well as a comparison with similar homes in the area
Purchase History
We collect this data history from publicly available records. To have your information removed, we recommend requesting removal directly through your county’s website.
| Date | Buyer | Sale Price | Title Company |
|---|---|---|---|
| Feinman Alex | $290,000 | -- |
Source: Public Records
Mortgage History
We collect this data history from publicly available records. To have your information removed, we recommend requesting removal directly through your county’s website.
| Date | Status | Borrower | Loan Amount |
|---|---|---|---|
| Open | Feinman Alex | $275,500 |
Source: Public Records
Tax History
| Year | Tax Paid | Tax Assessment Tax Assessment Total Assessment is a certain percentage of the fair market value that is determined by local assessors to be the total taxable value of land and additions on the property. | Land | Improvement |
|---|---|---|---|---|
| 2025 | $45 | $417,000 | $128,200 | $288,800 |
| 2024 | $4,262 | $373,500 | $121,500 | $252,000 |
| 2023 | $4,141 | $345,100 | $110,200 | $234,900 |
| 2022 | $4,120 | $310,500 | $103,500 | $207,000 |
| 2021 | $3,968 | $286,900 | $103,500 | $183,400 |
| 2020 | $3,905 | $280,100 | $96,700 | $183,400 |
| 2019 | $3,745 | $264,100 | $92,200 | $171,900 |
| 2018 | $3,589 | $248,900 | $92,200 | $156,700 |
| 2017 | $3,479 | $240,900 | $92,200 | $148,700 |
| 2016 | $3,381 | $232,700 | $92,200 | $140,500 |
| 2015 | $3,204 | $224,400 | $92,200 | $132,200 |
Source: Public Records
Map
Nearby Homes
- 47 Clems Way Unit 47
- 955 Middle Rd
- 17 David St
- 0 Keene Rd Unit 73459818
- 13 Bow Dr
- 219 Leonard St
- 2323 Robinson Rd
- 0 Land Way Unit 73479153
- 853 Main St
- 0 Rounseville Rd
- 37 Crestwood Cir Unit 37
- 36 Crestwood Cir Unit 36
- 67 Morses Ln
- 79 Park Dr
- 247 Braley Hill Rd
- 390 Upland St
- 47 Seth Daniel Dr
- 4 Summit St
- 1 Doctor Braley Rd
- 125 Doctor Braley Rd
Your Personal Tour Guide
Ask me questions while you tour the home.