1259 Walkabout Creek Rd Mineral Bluff, GA 30559
Estimated Value: $652,000 - $1,042,000
--
Bed
3
Baths
2,658
Sq Ft
$316/Sq Ft
Est. Value
About This Home
This home is located at 1259 Walkabout Creek Rd, Mineral Bluff, GA 30559 and is currently estimated at $838,667, approximately $315 per square foot. 1259 Walkabout Creek Rd is a home with nearby schools including Fannin County High School.
Ownership History
Date
Name
Owned For
Owner Type
Purchase Details
Closed on
Apr 30, 2013
Sold by
Lee Samuel Eugene
Bought by
Bear Paws Properties Llc
Current Estimated Value
Purchase Details
Closed on
Mar 6, 2013
Sold by
Bear Paws Properties Llc
Bought by
Lee Samuel Eugene
Purchase Details
Closed on
Oct 9, 2003
Sold by
Lee Samuel E
Bought by
Bear Paw Properties Llc
Purchase Details
Closed on
Feb 7, 2003
Sold by
Keda Properties Llc
Bought by
Lee Gene
Create a Home Valuation Report for This Property
The Home Valuation Report is an in-depth analysis detailing your home's value as well as a comparison with similar homes in the area
Home Values in the Area
Average Home Value in this Area
Purchase History
| Date | Buyer | Sale Price | Title Company |
|---|---|---|---|
| Bear Paws Properties Llc | -- | -- | |
| Bear Paws Properties Llc | -- | -- | |
| Lee Samuel Eugene | -- | -- | |
| Bear Paw Properties Llc | -- | -- | |
| Lee Samuel E | -- | -- | |
| Lee Gene | $38,500 | -- |
Source: Public Records
Tax History Compared to Growth
Tax History
| Year | Tax Paid | Tax Assessment Tax Assessment Total Assessment is a certain percentage of the fair market value that is determined by local assessors to be the total taxable value of land and additions on the property. | Land | Improvement |
|---|---|---|---|---|
| 2024 | $2,292 | $250,108 | $14,700 | $235,408 |
| 2023 | $2,025 | $198,576 | $10,600 | $187,976 |
| 2022 | $2,048 | $200,872 | $10,600 | $190,272 |
| 2021 | $1,395 | $99,472 | $10,000 | $89,472 |
| 2020 | $1,532 | $99,472 | $10,000 | $89,472 |
| 2019 | $1,532 | $99,472 | $10,000 | $89,472 |
| 2018 | $1,532 | $99,472 | $10,000 | $89,472 |
| 2017 | $1,810 | $102,314 | $10,000 | $92,314 |
| 2016 | $1,573 | $92,634 | $10,000 | $82,634 |
| 2015 | -- | $93,552 | $10,000 | $83,552 |
| 2014 | -- | $107,877 | $16,000 | $91,877 |
| 2013 | -- | $87,934 | $16,000 | $71,934 |
Source: Public Records
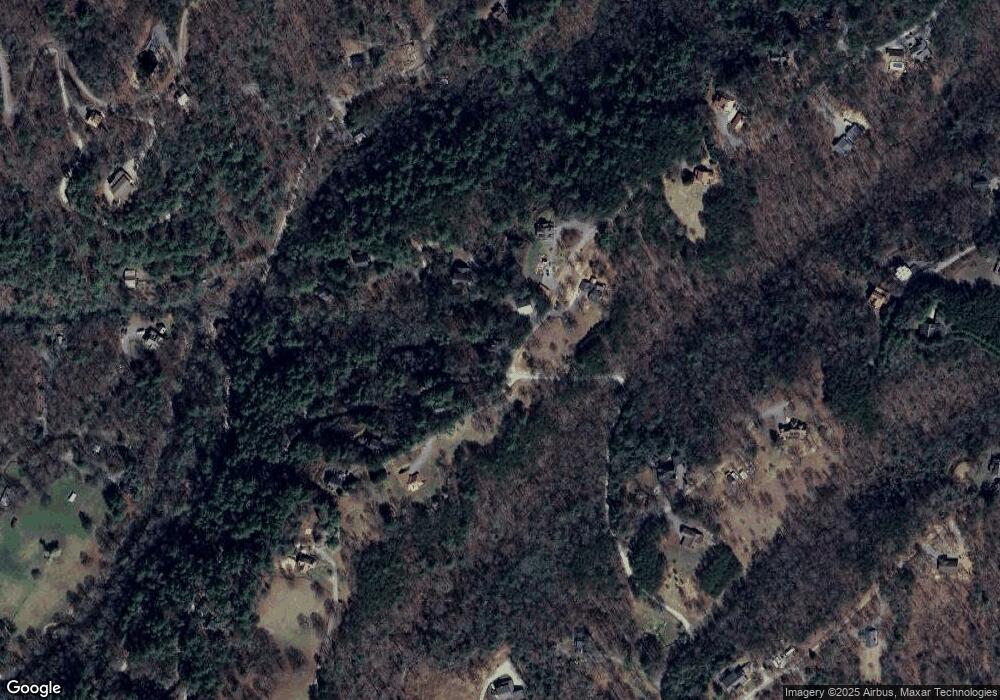
Map
Nearby Homes
- 34 Smokey Ridge Ln
- 105 Snowy Rd
- LOT 95 The Ridges
- 1600 My Mountain Rd
- 34 Mountain Lookout
- 99 Blue Cloud Trail
- 327 Dancing Trees Trail
- Lot 133 Ridges of Blue Ridge
- 419 Blue Ridge Trails
- 419 Blue Ridge Trail
- 91 Blue Grass Hollow
- 744 Old Loving Rd
- 136 Mountain Meadows Cir
- LT 133 Ridges of Blue Ridge
- 55 Trails End Ln
- 363 Crestview Dr
- 363 Crestview Dr
- 376 Crestview Dr
- 334 Crestview Dr
- 70 Burke Mountain
- 389 Crestview Dr
- 20 Burke Mountain View
- 20 Burke Mountain View
- 100 Burke Mountain View Unit 1
- 100 Burke Mountain View
- 134 Wild View Hollow
- 3AC Crestview Dr
- LOT 1 Crestview Dr
- LOT 4 Crestview Dr
- 0 Crestview Dr
- 333 Crestview Dr
- 179 Wild View Hollow
- 49 Smokey Ridge Ln
- 715 Walkabout Creek Rd
- 523 Walkabout Creek Rd