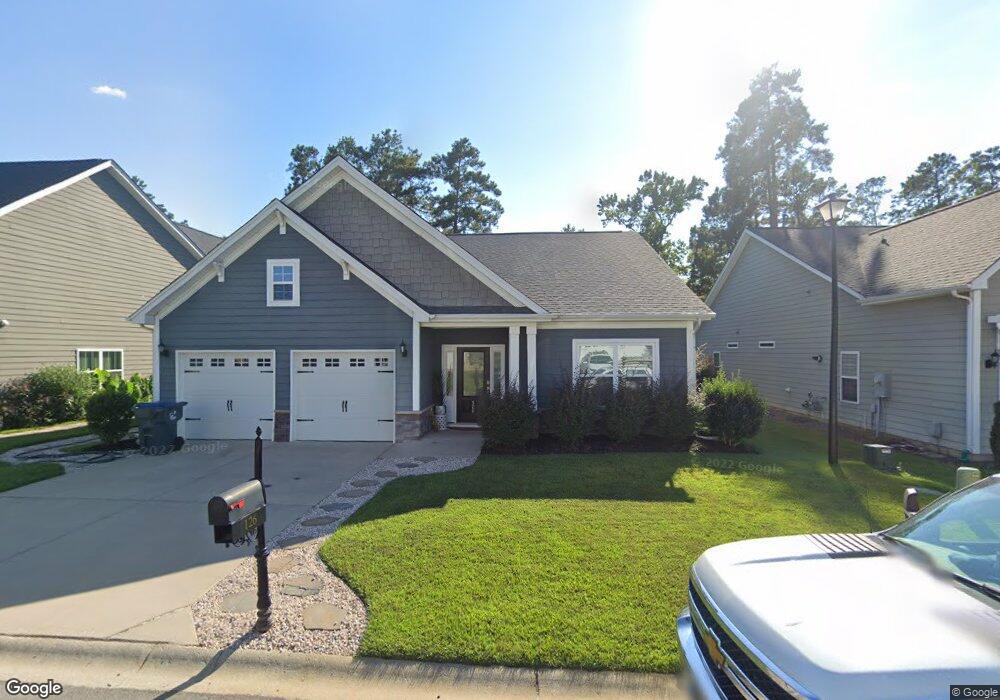
126 Azur Ave Unit 11 Chapin, SC 29036
Estimated Value: $509,000 - $560,282
3
Beds
2
Baths
1,705
Sq Ft
$314/Sq Ft
Est. Value
About This Home
This home is located at 126 Azur Ave Unit 11, Chapin, SC 29036 and is currently estimated at $534,571, approximately $313 per square foot. 126 Azur Ave Unit 11 is a home located in Lexington County with nearby schools including Chapin Elementary School, Chapin Intermediate, and Chapin High School.
Ownership History
Date
Name
Owned For
Owner Type
Purchase Details
Closed on
Sep 16, 2020
Sold by
Cheatham Emily S
Bought by
Carmona Mario and Carmona Corinne
Current Estimated Value
Purchase Details
Closed on
Sep 9, 2020
Sold by
Kasales Camilla J
Bought by
Barroso Nancy and Orodenker Michael
Purchase Details
Closed on
Sep 6, 2019
Sold by
Donaldson Candice M
Bought by
Kasales Camilla J
Purchase Details
Closed on
Oct 31, 2017
Sold by
Mungo Homes Inc
Bought by
Donaldson Candice M
Home Financials for this Owner
Home Financials are based on the most recent Mortgage that was taken out on this home.
Original Mortgage
$158,838
Interest Rate
3.83%
Mortgage Type
New Conventional
Purchase Details
Closed on
Mar 6, 2017
Sold by
Lighthouse Developments Inc
Bought by
Mungo Homes Inc
Create a Home Valuation Report for This Property
The Home Valuation Report is an in-depth analysis detailing your home's value as well as a comparison with similar homes in the area
Home Values in the Area
Average Home Value in this Area
Purchase History
| Date | Buyer | Sale Price | Title Company |
|---|---|---|---|
| Barroso Nancy | $329,325 | Templeton Law Firm Llc | |
| Kasales Camilla J | $252,000 | None Available | |
| Donaldson Candice M | $264,730 | None Available | |
| Mungo Homes Inc | $93,500 | None Available | |
| Carmona Mario | $158,888 | None Listed On Document |
Source: Public Records
Mortgage History
| Date | Status | Borrower | Loan Amount |
|---|---|---|---|
| Previous Owner | Donaldson Candice M | $158,838 |
Source: Public Records
Tax History Compared to Growth
Tax History
| Year | Tax Paid | Tax Assessment Tax Assessment Total Assessment is a certain percentage of the fair market value that is determined by local assessors to be the total taxable value of land and additions on the property. | Land | Improvement |
|---|---|---|---|---|
| 2024 | $3,060 | $20,000 | $2,800 | $17,200 |
| 2023 | $3,060 | $13,477 | $2,800 | $10,677 |
| 2022 | $2,081 | $13,477 | $2,800 | $10,677 |
| 2020 | $1,630 | $15,120 | $4,200 | $10,920 |
| 2019 | $1,794 | $10,589 | $2,540 | $8,049 |
| 2018 | $1,533 | $10,589 | $2,540 | $8,049 |
| 2017 | $488 | $1,188 | $1,188 | $0 |
| 2016 | $484 | $1,188 | $1,188 | $0 |
| 2014 | $464 | $1,188 | $1,188 | $0 |
| 2013 | -- | $2,760 | $2,760 | $0 |
Source: Public Records
Map
Nearby Homes
- 343 Amalfi Dr
- 348 Amalfi Dr
- 748 Crystal Lake Cir
- 125 Milmont Shores Rd
- 409 Caro Ln
- 0 Woodlake Cir
- 545 Superior Cir
- 345 Bent Oak Dr
- 117 Bogater Rd
- 106 Oak Brook Dr
- 1304 Amicks Ferry Rd
- 854 Elms Spinney Ln
- 1040 Night Harbor Cir
- 249 Daymark Dr
- 608 Misty Banks Dr
- 612 Misty Banks Dr
- 1029 Refuge Place
- 934 Salisbury Ct
- 820 Elms Spinney Ln
- 404 Lombard Way