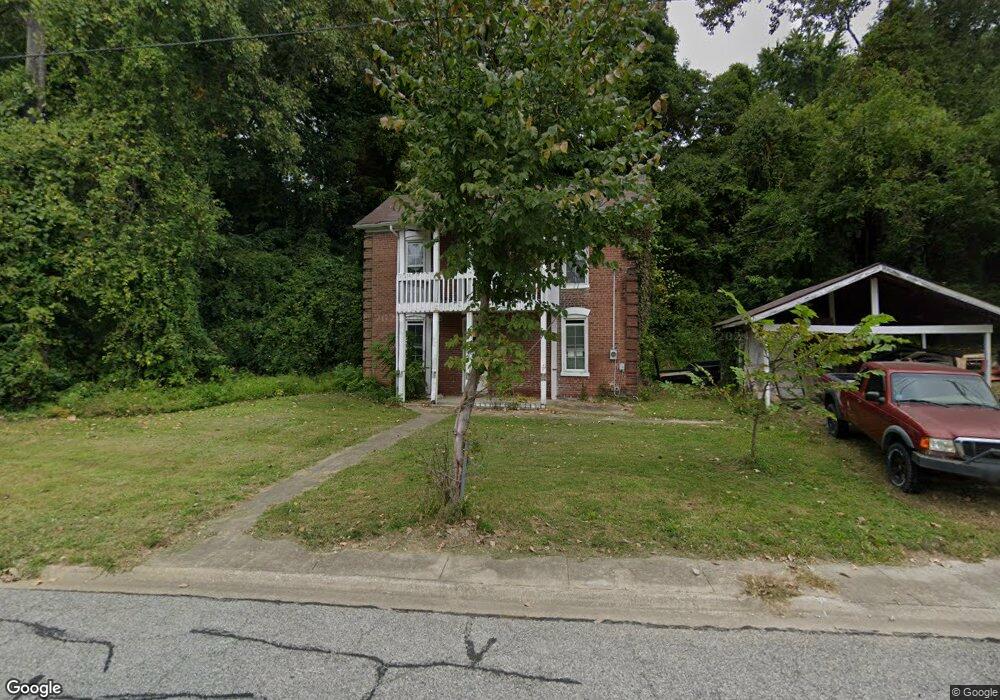
126 Black Jack Rd Collinsville, IL 62234
Estimated Value: $59,188 - $176,000
2
Beds
1
Bath
840
Sq Ft
$139/Sq Ft
Est. Value
About This Home
This home is located at 126 Black Jack Rd, Collinsville, IL 62234 and is currently estimated at $117,047, approximately $139 per square foot. 126 Black Jack Rd is a home located in Madison County with nearby schools including Webster Elementary School, Dorris Intermediate School, and Collinsville Middle School.
Ownership History
Date
Name
Owned For
Owner Type
Purchase Details
Closed on
Feb 11, 2016
Sold by
City Of Collinsville
Bought by
Calandro John and Calandro Tim
Current Estimated Value
Purchase Details
Closed on
Oct 9, 2014
Sold by
Us Bank National Association
Bought by
City Of Collinsville
Purchase Details
Closed on
Apr 14, 2014
Sold by
Walker James and Walker James R
Bought by
Us Bank National Association
Purchase Details
Closed on
Jan 16, 2007
Sold by
Mamino Sandra L
Bought by
Walker James R
Home Financials for this Owner
Home Financials are based on the most recent Mortgage that was taken out on this home.
Original Mortgage
$40,500
Interest Rate
6.21%
Mortgage Type
Purchase Money Mortgage
Create a Home Valuation Report for This Property
The Home Valuation Report is an in-depth analysis detailing your home's value as well as a comparison with similar homes in the area
Home Values in the Area
Average Home Value in this Area
Purchase History
| Date | Buyer | Sale Price | Title Company |
|---|---|---|---|
| Calandro John | -- | Abstracts & Titles Inc | |
| City Of Collinsville | -- | Servicelink | |
| Us Bank National Association | -- | None Available | |
| Walker James R | $45,000 | Netco |
Source: Public Records
Mortgage History
| Date | Status | Borrower | Loan Amount |
|---|---|---|---|
| Previous Owner | Walker James R | $40,500 |
Source: Public Records
Tax History Compared to Growth
Tax History
| Year | Tax Paid | Tax Assessment Tax Assessment Total Assessment is a certain percentage of the fair market value that is determined by local assessors to be the total taxable value of land and additions on the property. | Land | Improvement |
|---|---|---|---|---|
| 2024 | $328 | $5,130 | $4,610 | $520 |
| 2023 | $328 | $4,750 | $4,270 | $480 |
| 2022 | $313 | $4,250 | $3,820 | $430 |
| 2021 | $276 | $3,990 | $3,590 | $400 |
| 2020 | $266 | $3,810 | $3,430 | $380 |
| 2019 | $259 | $3,680 | $3,310 | $370 |
| 2018 | $253 | $3,490 | $3,140 | $350 |
| 2017 | $254 | $3,420 | $3,080 | $340 |
| 2016 | $267 | $3,420 | $3,080 | $340 |
| 2015 | $1,073 | $14,340 | $6,230 | $8,110 |
| 2014 | $1,073 | $14,340 | $6,230 | $8,110 |
| 2013 | $1,073 | $14,340 | $6,230 | $8,110 |
Source: Public Records
Map
Nearby Homes
- 238 Mill St
- 921 Prospect St
- 404 E Church St
- 919 Vine St
- 216 S Chestnut St
- 110 E Church St
- 501 Spring
- 121 S Seminary St
- 6506 Timber Lake Dr
- 617 N Morrison Ave
- 123 W Wickliffe Ave
- 308 Brown Ave
- 1210 Constance St
- 419 Bell St
- 506 W Clay St
- 125 S Hesperia St
- 1120 Williams St
- 580 N Guernsey St
- 0 Strong Ave
- 119 N Hesperia St
- 139 Black Jack Rd
- 121 Black Jack Rd
- 123 Black Jack Rd
- 111 Black Jack Rd
- 143 Black Jack Rd
- 240 Mill St
- 240 Mill St
- 113 Black Jack Rd
- 147 Black Jack Rd
- 146 Black Jack Rd
- 148 Black Jack Rd
- 149 Black Jack Rd
- 152 Black Jack Rd
- 157 Black Jack Rd
- 308 Mill St
- 236 Mill St
- 154 Black Jack Rd
- 228 Mill St
- 243 Mill St
- 156 Black Jack Rd
