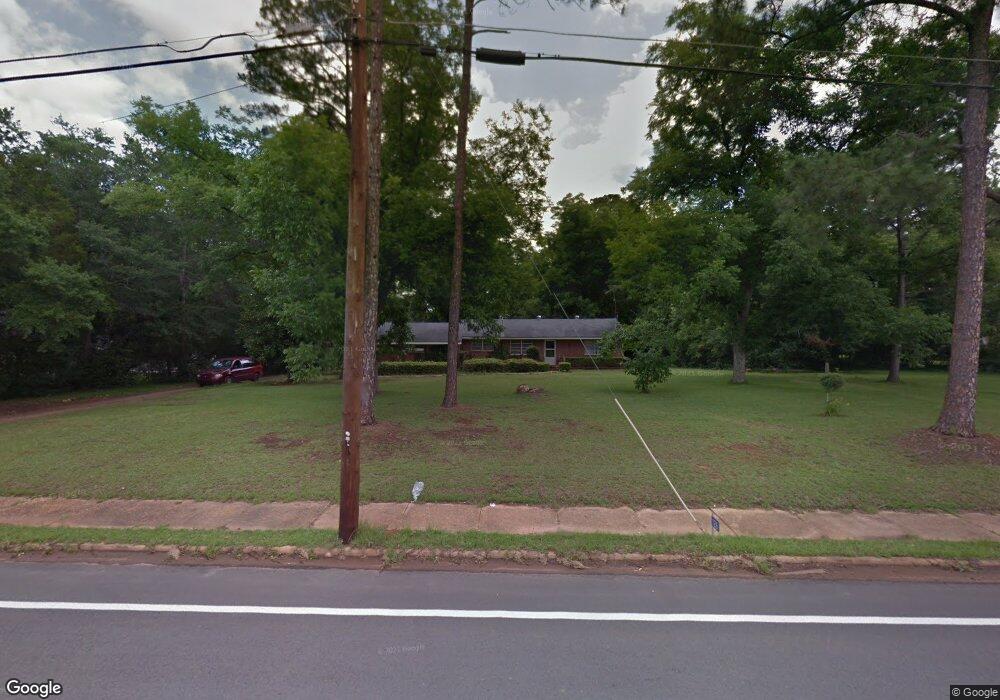
126 Blakely St Cuthbert, GA 39840
Estimated Value: $97,000 - $178,000
3
Beds
1
Bath
1,840
Sq Ft
$73/Sq Ft
Est. Value
About This Home
This home is located at 126 Blakely St, Cuthbert, GA 39840 and is currently estimated at $133,917, approximately $72 per square foot. 126 Blakely St is a home located in Randolph County with nearby schools including Randolph County Elementary School, Randolph Clay Middle School, and Randolph Clay High School.
Ownership History
Date
Name
Owned For
Owner Type
Purchase Details
Closed on
Jan 4, 2022
Sold by
Secretary Of Veterans Affairs
Bought by
Burnett Trevis
Current Estimated Value
Home Financials for this Owner
Home Financials are based on the most recent Mortgage that was taken out on this home.
Original Mortgage
$14,635
Interest Rate
3.45%
Mortgage Type
Cash
Purchase Details
Closed on
May 27, 2021
Sold by
Hsbc Bank Usa National Association Trust
Bought by
Secretary Of Veterans Affairs and C/O Loan Guaranty Svc
Purchase Details
Closed on
May 4, 2021
Sold by
Brown Ronald
Bought by
Hsbc Bank Usa National Association Trust and Mastr Reperforming Loan Trust
Purchase Details
Closed on
Feb 7, 2000
Sold by
Cornette Doris
Bought by
Brown Ronald W
Create a Home Valuation Report for This Property
The Home Valuation Report is an in-depth analysis detailing your home's value as well as a comparison with similar homes in the area
Home Values in the Area
Average Home Value in this Area
Purchase History
| Date | Buyer | Sale Price | Title Company |
|---|---|---|---|
| Burnett Trevis | $15,000 | -- | |
| Burnett Trevis | $15,000 | -- | |
| Burnett Trevis | $15,000 | -- | |
| Secretary Of Veterans Affairs | $43,591 | -- | |
| Secretary Of Veterans Affairs | $43,591 | -- | |
| Hsbc Bank Usa National Association Trust | $43,591 | -- | |
| Hsbc Bank Usa National Association Trust | $43,591 | -- | |
| Brown Ronald W | $60,900 | -- | |
| Brown Ronald W | $60,900 | -- |
Source: Public Records
Mortgage History
| Date | Status | Borrower | Loan Amount |
|---|---|---|---|
| Closed | Burnett Trevis | $14,635 |
Source: Public Records
Tax History
| Year | Tax Paid | Tax Assessment Tax Assessment Total Assessment is a certain percentage of the fair market value that is determined by local assessors to be the total taxable value of land and additions on the property. | Land | Improvement |
|---|---|---|---|---|
| 2025 | $2,041 | $49,128 | $3,920 | $45,208 |
| 2024 | $1,879 | $45,892 | $3,560 | $42,332 |
| 2023 | $1,624 | $45,892 | $3,560 | $42,332 |
| 2022 | $1,027 | $29,012 | $2,680 | $26,332 |
| 2021 | $893 | $26,854 | $2,240 | $24,614 |
| 2020 | $921 | $26,854 | $2,240 | $24,614 |
| 2019 | $919 | $26,854 | $2,240 | $24,614 |
| 2018 | $948 | $26,854 | $2,240 | $24,614 |
| 2017 | $884 | $26,854 | $2,240 | $24,614 |
| 2016 | $888 | $26,854 | $2,240 | $24,614 |
| 2015 | -- | $26,854 | $2,240 | $24,614 |
| 2014 | -- | $26,913 | $2,240 | $24,673 |
| 2013 | -- | $26,912 | $2,240 | $24,672 |
Source: Public Records
Map
Nearby Homes
- 298 Nelson Coffin Dr
- 396 Hood St
- 140 College St
- 42 W Harris St
- 0 District Line Rd Unit 10518137
- 365 Highland Ave
- Mattox Rd
- Old Spring Rd
- Cotton Hill Rd
- 0 County Rd 70
- 0 Benevolence Hwy Unit 26314983
- Pierce Rd
- 135 Eleven Bridges Rd
- County Line Rd Lot Unit WP001
- 3833 US Highway 82
- 229 +-ac Cty Rd 62 Cty Rd 160 (Morgan Rd)
- Sam Bentley Rd
- 0 Carver St
- 3437 Us Highway 82
- 3109 Calhoun St
- 134 Blakely St
- 116 Blakely St
- 3581 Ga Highway 216
- 125 Blakely St
- 139 Blakely St
- 153 Blakely St
- 3447 Ga Highway 216
- 100 Blakely St
- 90 Blakely St
- 3554 Ga Highway 216
- 3490 Ga Highway 216
- 3361 Ga Highway 216
- 86 Blakely St
- 89 Blakely St
- 83 Blakely St
- 178 Blakely St
- 186 Blakely St
- 3323 Ga Highway 216
- 165 Blakely St
- 67 Blakely St
Your Personal Tour Guide
Ask me questions while you tour the home.