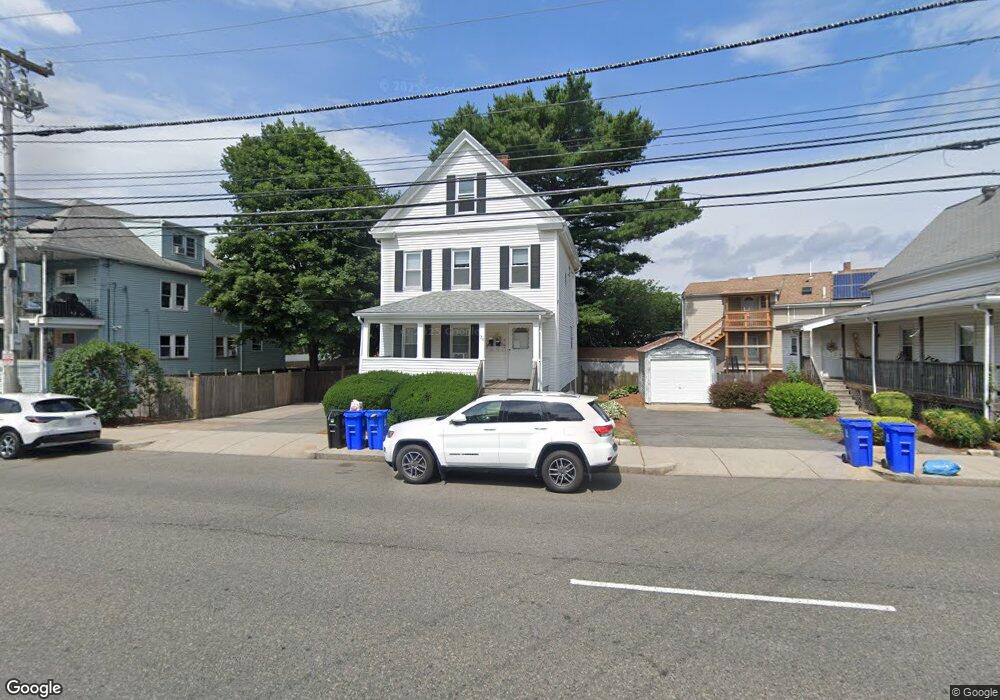
126 Broadway Unit 1 Malden, MA 02148
Linden NeighborhoodEstimated Value: $593,000 - $725,000
4
Beds
2
Baths
1,623
Sq Ft
$418/Sq Ft
Est. Value
About This Home
This home is located at 126 Broadway Unit 1, Malden, MA 02148 and is currently estimated at $678,155, approximately $417 per square foot. 126 Broadway Unit 1 is a home located in Middlesex County with nearby schools including Malden High School and Malden Catholic.
Ownership History
Date
Name
Owned For
Owner Type
Purchase Details
Closed on
Oct 12, 2004
Sold by
Mccauley William P
Bought by
Santangelo Michael R
Current Estimated Value
Home Financials for this Owner
Home Financials are based on the most recent Mortgage that was taken out on this home.
Original Mortgage
$270,000
Outstanding Balance
$134,344
Interest Rate
5.84%
Mortgage Type
Purchase Money Mortgage
Estimated Equity
$543,811
Purchase Details
Closed on
Apr 13, 1999
Sold by
Alexander Richard A and Alexander Virginia L
Bought by
Mccauley William P
Create a Home Valuation Report for This Property
The Home Valuation Report is an in-depth analysis detailing your home's value as well as a comparison with similar homes in the area
Home Values in the Area
Average Home Value in this Area
Purchase History
| Date | Buyer | Sale Price | Title Company |
|---|---|---|---|
| Santangelo Michael R | $300,000 | -- | |
| Mccauley William P | $85,000 | -- |
Source: Public Records
Mortgage History
| Date | Status | Borrower | Loan Amount |
|---|---|---|---|
| Open | Santangelo Michael R | $270,000 | |
| Previous Owner | Mccauley William P | $45,000 |
Source: Public Records
Tax History Compared to Growth
Tax History
| Year | Tax Paid | Tax Assessment Tax Assessment Total Assessment is a certain percentage of the fair market value that is determined by local assessors to be the total taxable value of land and additions on the property. | Land | Improvement |
|---|---|---|---|---|
| 2025 | $61 | $538,900 | $222,800 | $316,100 |
| 2024 | $5,764 | $493,100 | $214,800 | $278,300 |
| 2023 | $5,640 | $462,700 | $190,900 | $271,800 |
| 2022 | $5,373 | $435,100 | $171,100 | $264,000 |
| 2021 | $5,732 | $466,400 | $171,100 | $295,300 |
| 2020 | $5,413 | $427,900 | $152,400 | $275,500 |
| 2019 | $5,189 | $391,000 | $145,200 | $245,800 |
| 2018 | $5,364 | $380,700 | $145,200 | $235,500 |
| 2017 | $5,224 | $368,700 | $145,200 | $223,500 |
| 2016 | $5,071 | $334,500 | $133,300 | $201,200 |
| 2015 | $4,944 | $314,300 | $126,900 | $187,400 |
| 2014 | $4,764 | $295,900 | $115,400 | $180,500 |
Source: Public Records
Map
Nearby Homes