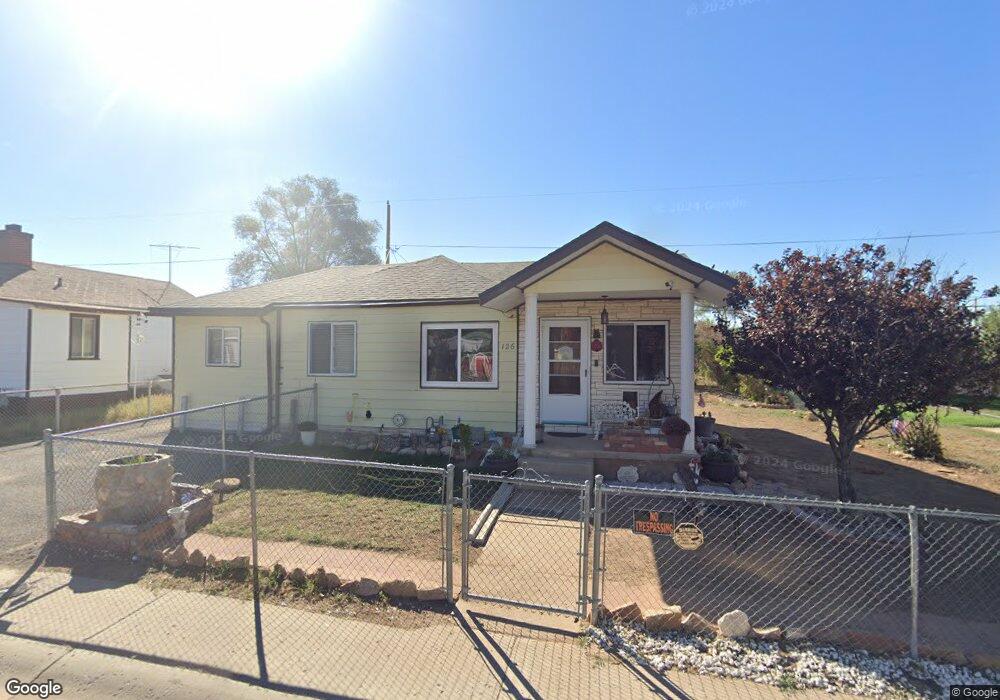
126 Carson Ave East Carbon, UT 84520
Estimated Value: $112,000 - $150,000
3
Beds
1
Bath
1,104
Sq Ft
$114/Sq Ft
Est. Value
About This Home
This home is located at 126 Carson Ave, East Carbon, UT 84520 and is currently estimated at $126,354, approximately $114 per square foot. 126 Carson Ave is a home located in Carbon County with nearby schools including Wellington School, Mont Harmon Junior High School, and Carbon High School.
Ownership History
Date
Name
Owned For
Owner Type
Purchase Details
Closed on
May 8, 2023
Sold by
Sherwood Phil
Bought by
Clark Melissa
Current Estimated Value
Purchase Details
Closed on
Jan 14, 2019
Sold by
Carlson Katie and Beck Jamie
Bought by
Sherwood Phil and Sherwood Valerie
Purchase Details
Closed on
Dec 17, 2007
Sold by
Reed Woodi Charlene
Bought by
Cooper John M and Cooper Roma K
Home Financials for this Owner
Home Financials are based on the most recent Mortgage that was taken out on this home.
Original Mortgage
$37,628
Interest Rate
6.2%
Mortgage Type
New Conventional
Purchase Details
Closed on
Feb 27, 2006
Sold by
Reed Woodi Charlene
Bought by
Reed Woodi Charlene and Reed Gates Lynn
Create a Home Valuation Report for This Property
The Home Valuation Report is an in-depth analysis detailing your home's value as well as a comparison with similar homes in the area
Purchase History
We collect this data history from publicly available records. To have your information removed, we recommend requesting removal directly through your county’s website.
| Date | Buyer | Sale Price | Title Company |
|---|---|---|---|
| Clark Melissa | -- | Investors Title Insurance Agen | |
| Sherwood Phil | -- | South Eastern Utah Title Co | |
| Cooper John M | -- | South Eastern Utah Title Co | |
| Reed Woodi Charlene | -- | South Eastern Utah Title Co | |
| Reed Woodi Charlene | -- | Professional Title Services |
Source: Public Records
Mortgage History
We collect this data history from publicly available records. To have your information removed, we recommend requesting removal directly through your county’s website.
| Date | Status | Borrower | Loan Amount |
|---|---|---|---|
| Previous Owner | Cooper John M | $37,628 |
Source: Public Records
Tax History
| Year | Tax Paid | Tax Assessment Tax Assessment Total Assessment is a certain percentage of the fair market value that is determined by local assessors to be the total taxable value of land and additions on the property. | Land | Improvement |
|---|---|---|---|---|
| 2025 | $787 | $41,506 | $8,261 | $33,245 |
| 2024 | $969 | $55,193 | $8,222 | $46,971 |
| 2023 | $712 | $46,183 | $3,764 | $42,419 |
| 2022 | $669 | $38,845 | $2,805 | $36,040 |
| 2021 | $555 | $51,905 | $5,100 | $46,805 |
| 2020 | $499 | $24,617 | $0 | $0 |
| 2019 | $398 | $20,039 | $0 | $0 |
| 2018 | $392 | $20,039 | $0 | $0 |
| 2017 | $389 | $20,039 | $0 | $0 |
| 2016 | $350 | $20,039 | $0 | $0 |
| 2015 | $350 | $20,039 | $0 | $0 |
| 2014 | $346 | $20,126 | $0 | $0 |
| 2013 | $332 | $20,126 | $0 | $0 |
Source: Public Records
Map
Nearby Homes
- 302 W Hwy 123
- 140 Carson Ave
- 207 N Rawlins St
- 112 Shuman St
- 124 Grassy Trail Dr
- 176 Grassy Trail Dr
- 163 Carson Ave
- 148 Grassy Trail Dr
- 171 Berkley Ave
- 105 2nd East St
- 320 Columbia Dr
- 100 Whitmore Dr
- 136 Whitmore Dr
- 336 Columbia Dr
- 333 Denver Ave
- 607 E Geneva Dr
- 119 3rd W
- 128 4th W
- 120 7th W
- 121 8th W
- 127 Carson Ave
- 126 Denver Ave
- 125 Carson Ave
- 128 Carson Ave
- 124 Denver Ave
- 217 Berkley Ave
- 132 Carson Ave
- 133 Carson Ave
- 132 Denver Ave
- 223 Wilkins St
- 134 Carson Ave
- 131 Berkley Ave
- 131 Denver Ave
- 129 Berkley Ave
- 125 Denver Ave
- 123 Denver Ave
- 127 Berkley Ave
- 137 Carson Ave
- 133 Denver Ave
- 215 Berkley Ave
Your Personal Tour Guide
Ask me questions while you tour the home.