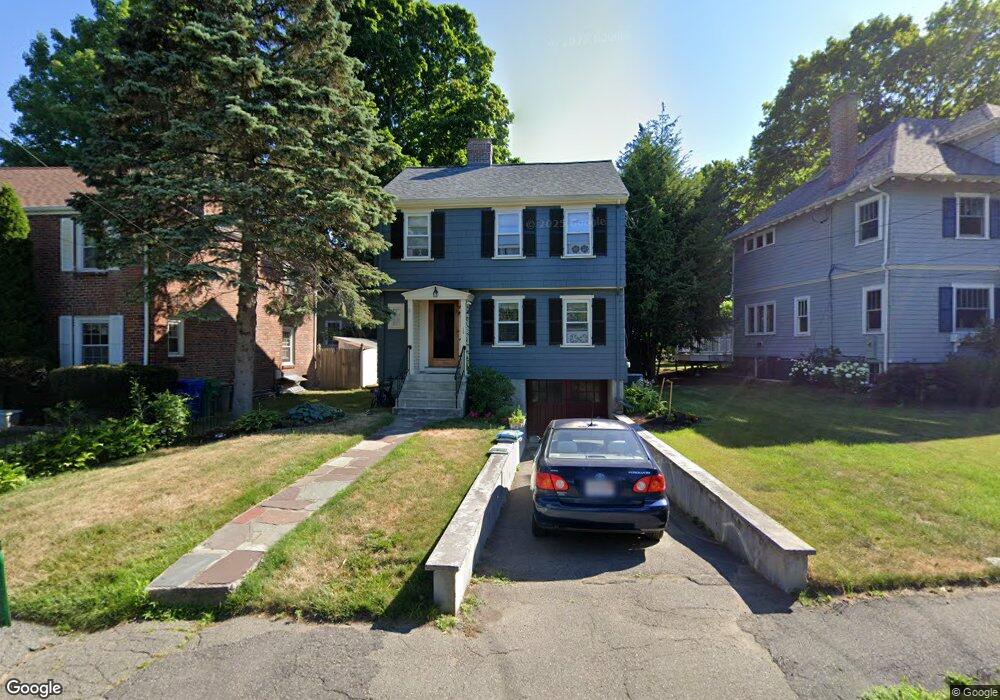
126 Clark St Newton Center, MA 02459
Thompsonville NeighborhoodEstimated Value: $1,184,000 - $1,209,811
3
Beds
1
Bath
1,176
Sq Ft
$1,018/Sq Ft
Est. Value
About This Home
This home is located at 126 Clark St, Newton Center, MA 02459 and is currently estimated at $1,196,953, approximately $1,017 per square foot. 126 Clark St is a home located in Middlesex County with nearby schools including Bowen School, Oak Hill Middle School, and Newton South High School.
Ownership History
Date
Name
Owned For
Owner Type
Purchase Details
Closed on
May 12, 2000
Sold by
Hanser Suzanne B
Bought by
Dorschner Eileen G
Current Estimated Value
Purchase Details
Closed on
Jul 28, 1995
Sold by
Meyer Douglas E and Meyer Sheila M
Bought by
Hanser Suzanne B
Purchase Details
Closed on
Aug 26, 1988
Sold by
Willinger Marian
Bought by
Meyer Douglas E
Create a Home Valuation Report for This Property
The Home Valuation Report is an in-depth analysis detailing your home's value as well as a comparison with similar homes in the area
Home Values in the Area
Average Home Value in this Area
Purchase History
| Date | Buyer | Sale Price | Title Company |
|---|---|---|---|
| Dorschner Eileen G | $370,000 | -- | |
| Hanser Suzanne B | $270,000 | -- | |
| Meyer Douglas E | $216,500 | -- |
Source: Public Records
Mortgage History
| Date | Status | Borrower | Loan Amount |
|---|---|---|---|
| Open | Meyer Douglas E | $61,000 | |
| Closed | Meyer Douglas E | $60,000 |
Source: Public Records
Tax History Compared to Growth
Tax History
| Year | Tax Paid | Tax Assessment Tax Assessment Total Assessment is a certain percentage of the fair market value that is determined by local assessors to be the total taxable value of land and additions on the property. | Land | Improvement |
|---|---|---|---|---|
| 2025 | $8,815 | $899,500 | $0 | $0 |
| 2024 | $8,523 | $0 | $0 | $0 |
| 2023 | $8,123 | $797,900 | $700,600 | $97,300 |
| 2022 | $7,772 | $738,800 | $648,700 | $90,100 |
| 2021 | $6,541 | $697,000 | $612,000 | $85,000 |
| 2020 | $7,277 | $697,000 | $612,000 | $85,000 |
| 2019 | $7,072 | $676,700 | $594,200 | $82,500 |
| 2018 | $5,987 | $622,500 | $536,000 | $86,500 |
| 2017 | $6,531 | $587,300 | $505,700 | $81,600 |
| 2016 | $6,246 | $548,900 | $472,600 | $76,300 |
| 2015 | $5,956 | $513,000 | $441,700 | $71,300 |
Source: Public Records
Map
Nearby Homes
- 42 Sunhill Ln
- 671 Boylston St
- 625 Boylston St
- 628 Boylston St
- 5 Halcyon Rd
- 125 Oakdale Rd
- 21 Philbrick Rd
- 19 Selwyn Rd
- 1308 Walnut St
- 1292 Walnut St
- 1597 Centre St Unit 1597
- 1597 Centre St
- 42 Bow Rd
- 35 Haynes Rd
- 1623-1625 Centre St
- 1629 Centre St
- 250 Woodcliff Rd
- 1151 Walnut St Unit 205
- 1151 Walnut St Unit 405
- 1151 Walnut St Unit 207
- 130 Clark St
- 122 Clark St
- 68 Stearns St
- 62 Stearns St
- 118 Clark St
- 56 Stearns St
- 136 Clark St
- 131 Clark St
- 50 Stearns St
- 127 Clark St
- 135 Clark St
- 119 Clark St
- 117 Clark St
- 117 Clark St Unit 117
- 117 Clark St Unit 1
- 123 Clark St Unit 1
- 123 Clark St
- 123 Clark St Unit 2
- 123 Clark St Unit 123
- 144 Clark St