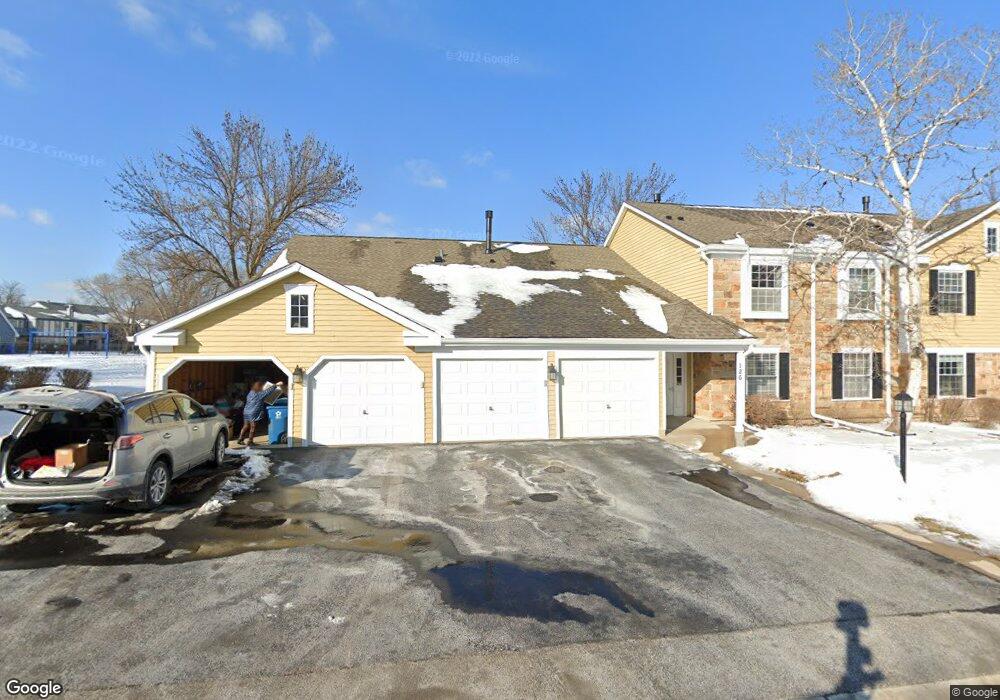
126 Cleveland Ct Unit 1513L Schaumburg, IL 60193
Olde Schaumburg NeighborhoodEstimated Value: $280,000 - $322,000
2
Beds
--
Bath
1,500
Sq Ft
$197/Sq Ft
Est. Value
About This Home
This home is located at 126 Cleveland Ct Unit 1513L, Schaumburg, IL 60193 and is currently estimated at $294,963, approximately $196 per square foot. 126 Cleveland Ct Unit 1513L is a home located in Cook County with nearby schools including Michael Collins Elementary School, Robert Frost Junior High School, and J B Conant High School.
Ownership History
Date
Name
Owned For
Owner Type
Purchase Details
Closed on
May 24, 2007
Sold by
Hobday Erik W
Bought by
Bobella Halina
Current Estimated Value
Home Financials for this Owner
Home Financials are based on the most recent Mortgage that was taken out on this home.
Original Mortgage
$8,964
Outstanding Balance
$5,467
Interest Rate
6.22%
Mortgage Type
Stand Alone Second
Estimated Equity
$289,496
Purchase Details
Closed on
Jun 6, 2002
Sold by
Banas Jennifer R Hobday
Bought by
Hobday Erik W
Purchase Details
Closed on
Mar 27, 1997
Sold by
Hock Michelle L and Riggins Michelle L
Bought by
Hobday Erik W
Home Financials for this Owner
Home Financials are based on the most recent Mortgage that was taken out on this home.
Original Mortgage
$87,200
Interest Rate
7.65%
Mortgage Type
Balloon
Create a Home Valuation Report for This Property
The Home Valuation Report is an in-depth analysis detailing your home's value as well as a comparison with similar homes in the area
Home Values in the Area
Average Home Value in this Area
Purchase History
| Date | Buyer | Sale Price | Title Company |
|---|---|---|---|
| Bobella Halina | $180,000 | Git | |
| Hobday Erik W | -- | -- | |
| Hobday Erik W | $109,000 | -- |
Source: Public Records
Mortgage History
| Date | Status | Borrower | Loan Amount |
|---|---|---|---|
| Open | Bobella Halina | $8,964 | |
| Previous Owner | Hobday Erik W | $87,200 |
Source: Public Records
Tax History Compared to Growth
Tax History
| Year | Tax Paid | Tax Assessment Tax Assessment Total Assessment is a certain percentage of the fair market value that is determined by local assessors to be the total taxable value of land and additions on the property. | Land | Improvement |
|---|---|---|---|---|
| 2024 | $5,107 | $21,548 | $6,148 | $15,400 |
| 2023 | $4,924 | $21,548 | $6,148 | $15,400 |
| 2022 | $4,924 | $21,548 | $6,148 | $15,400 |
| 2021 | $3,762 | $15,743 | $7,876 | $7,867 |
| 2020 | $3,765 | $15,743 | $7,876 | $7,867 |
| 2019 | $3,771 | $17,500 | $7,876 | $9,624 |
| 2018 | $2,760 | $12,632 | $6,627 | $6,005 |
| 2017 | $2,734 | $12,632 | $6,627 | $6,005 |
| 2016 | $2,800 | $12,632 | $6,627 | $6,005 |
| 2015 | $2,796 | $11,970 | $5,763 | $6,207 |
| 2014 | $2,782 | $11,970 | $5,763 | $6,207 |
| 2013 | $3,124 | $13,464 | $5,763 | $7,701 |
Source: Public Records
Map
Nearby Homes
- 125 Cleveland Ct Unit M2
- 287 Pembridge Ln Unit B2
- 22 Waterbury Ln Unit N1
- 91 Lambert Dr Unit B1
- 350 Newgate Ct Unit 2Z
- 85 Marble Hill Ct Unit A1
- 300 S Roselle Rd Unit 519
- 300 S Roselle Rd Unit 419
- 300 S Roselle Rd Unit 116
- 300 S Roselle Rd Unit 207
- 28 Ascot Cir
- 22 Ascot Cir
- 147 Fulbright Ln
- 421 Summit Dr
- 153 Fulbright Ln
- 121 Chatsworth Cir
- 21 White Pine Dr
- 13 Sarahs Grove Ln
- 223 Gareth Ln
- 602 Eastview Ct Unit Z1
- 126 Cleveland Ct Unit 1513L
- 126 Cleveland Ct Unit 1513L
- 126 Cleveland Ct Unit 1513L
- 126 Cleveland Ct Unit 2
- 126 Cleveland Ct Unit N2
- 126 Cleveland Ct Unit N1
- 130 Cleveland Ct Unit 1513R
- 130 Cleveland Ct Unit 1513R
- 130 Cleveland Ct Unit 1513R
- 130 Cleveland Ct Unit 1513R
- 130 Cleveland Ct Unit N1
- 130 Cleveland Ct Unit 2
- 122 Cleveland Ct Unit 1512R
- 122 Cleveland Ct Unit 1512R
- 122 Cleveland Ct Unit 1512R
- 122 Cleveland Ct Unit 1512R
- 122 Cleveland Ct Unit 1
- 122 Cleveland Ct Unit N2
- 132 Cleveland Ct Unit 1614L
- 132 Cleveland Ct Unit 1614L