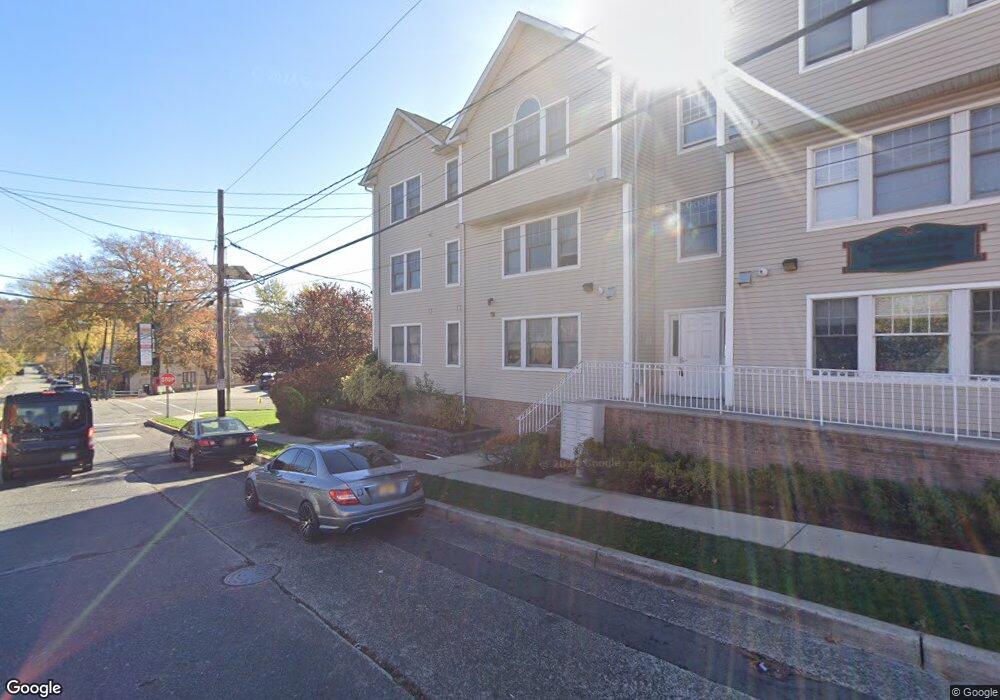
126 E Columbia Ave Unit 8 Palisades Park, NJ 07650
Estimated Value: $436,000 - $641,000
2
Beds
2
Baths
1,000
Sq Ft
$513/Sq Ft
Est. Value
About This Home
This home is located at 126 E Columbia Ave Unit 8, Palisades Park, NJ 07650 and is currently estimated at $512,899, approximately $512 per square foot. 126 E Columbia Ave Unit 8 is a home located in Bergen County with nearby schools including Lindbergh Elementary School, Palisades Park Jr Sr High School, and Notre Dame Academy.
Create a Home Valuation Report for This Property
The Home Valuation Report is an in-depth analysis detailing your home's value as well as a comparison with similar homes in the area
Home Values in the Area
Average Home Value in this Area
Tax History Compared to Growth
Tax History
| Year | Tax Paid | Tax Assessment Tax Assessment Total Assessment is a certain percentage of the fair market value that is determined by local assessors to be the total taxable value of land and additions on the property. | Land | Improvement |
|---|---|---|---|---|
| 2025 | $5,586 | $399,600 | $260,000 | $139,600 |
| 2024 | $5,486 | $383,900 | $247,500 | $136,400 |
| 2023 | $5,393 | $370,900 | $240,000 | $130,900 |
| 2022 | $5,393 | $350,400 | $225,000 | $125,400 |
| 2021 | $5,184 | $337,100 | $215,000 | $122,100 |
| 2020 | $5,402 | $350,100 | $225,000 | $125,100 |
| 2019 | $5,791 | $285,000 | $225,000 | $60,000 |
| 2018 | $5,640 | $285,000 | $225,000 | $60,000 |
| 2017 | $5,583 | $285,000 | $225,000 | $60,000 |
| 2016 | $5,418 | $285,000 | $225,000 | $60,000 |
| 2015 | $6,110 | $328,300 | $225,000 | $103,300 |
| 2014 | $5,834 | $328,300 | $225,000 | $103,300 |
Source: Public Records
Map
Nearby Homes
- 211 E Harriet Ave
- 212 E Harriet Ave Unit A
- 302 E Harriet Ave
- 46A E Homestead Ave Unit A
- 681 Maple Ave
- 213 Glen Ave
- 699 Elm Ave
- 10 W Edsall Ave Unit B
- 25 W Edsall Ave Unit A
- 757 Ray Ave
- 1027 Maple Ave
- 54 W Columbia Ave
- 221 10th St Unit B
- 269B 7th St
- 733 Grand Ave
- 118 Bergen Blvd Unit 3A
- 329 5th St Unit B
- 725 Broad Ave Unit 5A
- 418 E Brinkerhoff Ave
- 345 Roff Ave
- 126 E Columbia Ave
- 126 E Columbia Ave Unit 3
- 126 E Columbia Ave Unit 9
- 126 E Columbia Ave Unit 12
- 126 E Columbia Ave Unit 10
- 126 E Columbia Ave Unit 7
- 126 E Columbia Ave Unit 6
- 126 E Columbia Ave Unit 5
- 126 E Columbia Ave Unit 4
- 126 E Columbia Ave Unit 2
- 126 E Columbia Ave Unit 1
- 126 E Columbia Ave Unit 11
- 16 State Rt 5
- 124 E Columbia Ave
- 124 E Columbia Ave Unit 2Fl
- 16 New Jersey 5
- 118 E Columbia Ave
- 118 E Columbia Ave Unit 1
- 118 E Columbia Ave Unit 2
- 127 E Columbia Ave Unit B-1