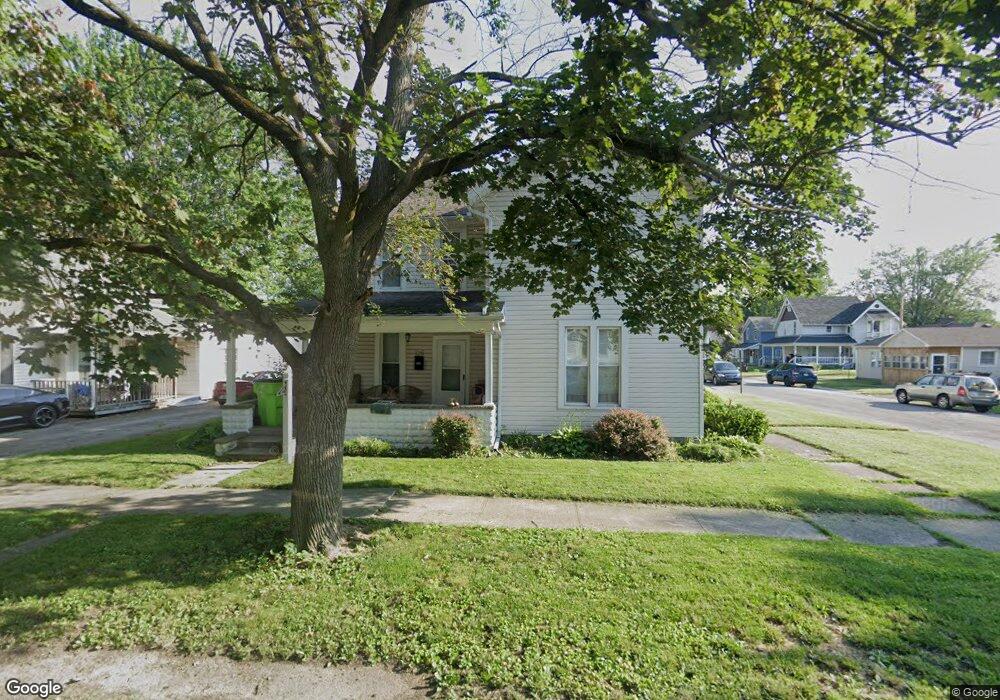
126 E High St Fostoria, OH 44830
Estimated Value: $89,000 - $111,000
3
Beds
2
Baths
1,821
Sq Ft
$55/Sq Ft
Est. Value
About This Home
This home is located at 126 E High St, Fostoria, OH 44830 and is currently estimated at $99,598, approximately $54 per square foot. 126 E High St is a home with nearby schools including Fostoria Intermediate Elementary School and Fostoria Junior/Senior High School.
Ownership History
Date
Name
Owned For
Owner Type
Purchase Details
Closed on
May 19, 2023
Sold by
Bickers Brittney A and Bickers Jonathon L
Bought by
Bickers Jonathon L and Bickers Brittney A
Current Estimated Value
Purchase Details
Closed on
Sep 28, 2018
Sold by
Matz John A and Matz Lisa
Bought by
Bickers Jonathon L and Bickers Brittney A
Home Financials for this Owner
Home Financials are based on the most recent Mortgage that was taken out on this home.
Original Mortgage
$33,750
Interest Rate
4.5%
Mortgage Type
New Conventional
Purchase Details
Closed on
May 12, 2007
Sold by
Matz John A and Garland Barbara A
Bought by
Matz Joan A and Matz Lisa
Purchase Details
Closed on
Feb 20, 2003
Sold by
Matz Kenneth L
Bought by
Matz Mary Frances
Purchase Details
Closed on
Jul 20, 1998
Sold by
Matz Kenneth L
Bought by
Matz Kenneth L
Purchase Details
Closed on
Sep 1, 1985
Create a Home Valuation Report for This Property
The Home Valuation Report is an in-depth analysis detailing your home's value as well as a comparison with similar homes in the area
Home Values in the Area
Average Home Value in this Area
Purchase History
| Date | Buyer | Sale Price | Title Company |
|---|---|---|---|
| Bickers Jonathon L | -- | Golden Key Title | |
| Bickers Jonathon L | $45,000 | Golden Key Title Agency | |
| Matz Joan A | -- | None Available | |
| Matz Mary Frances | -- | -- | |
| Matz Kenneth L | -- | -- | |
| -- | $20,000 | -- |
Source: Public Records
Mortgage History
| Date | Status | Borrower | Loan Amount |
|---|---|---|---|
| Open | Bickers Jonathon L | $73,600 | |
| Previous Owner | Bickers Jonathon L | $33,750 |
Source: Public Records
Tax History Compared to Growth
Tax History
| Year | Tax Paid | Tax Assessment Tax Assessment Total Assessment is a certain percentage of the fair market value that is determined by local assessors to be the total taxable value of land and additions on the property. | Land | Improvement |
|---|---|---|---|---|
| 2024 | $1,345 | $26,060 | $3,140 | $22,920 |
| 2023 | $1,348 | $26,060 | $3,140 | $22,920 |
| 2022 | $1,163 | $20,030 | $2,600 | $17,430 |
| 2021 | $1,282 | $20,030 | $2,600 | $17,430 |
| 2020 | $1,194 | $20,038 | $2,604 | $17,434 |
| 2019 | $1,162 | $19,341 | $2,513 | $16,828 |
| 2018 | $1,184 | $19,341 | $2,513 | $16,828 |
| 2017 | $1,183 | $19,341 | $2,513 | $16,828 |
| 2016 | $771 | $14,081 | $2,678 | $11,403 |
| 2015 | $759 | $14,081 | $2,678 | $11,403 |
| 2014 | $724 | $14,081 | $2,678 | $11,403 |
| 2013 | $848 | $15,306 | $2,912 | $12,394 |
Source: Public Records
Map
Nearby Homes
- 220 E High St
- 540 N Poplar St
- 633 Maple St
- 321 Mcdougal St
- 520 N Union St
- 723 N Union St
- 203 N Union St
- 412 E Center St
- 133 E South St
- 0 W South Route 12
- 931 N Union St
- 711 Circle Dr
- 827 Buckley St
- 207 W Culbertson St
- 892 N Countyline St
- 348 W South St
- 900 N Countyline St
- 481 Beverly Dr
- 509 College Ave
- 351 W South St