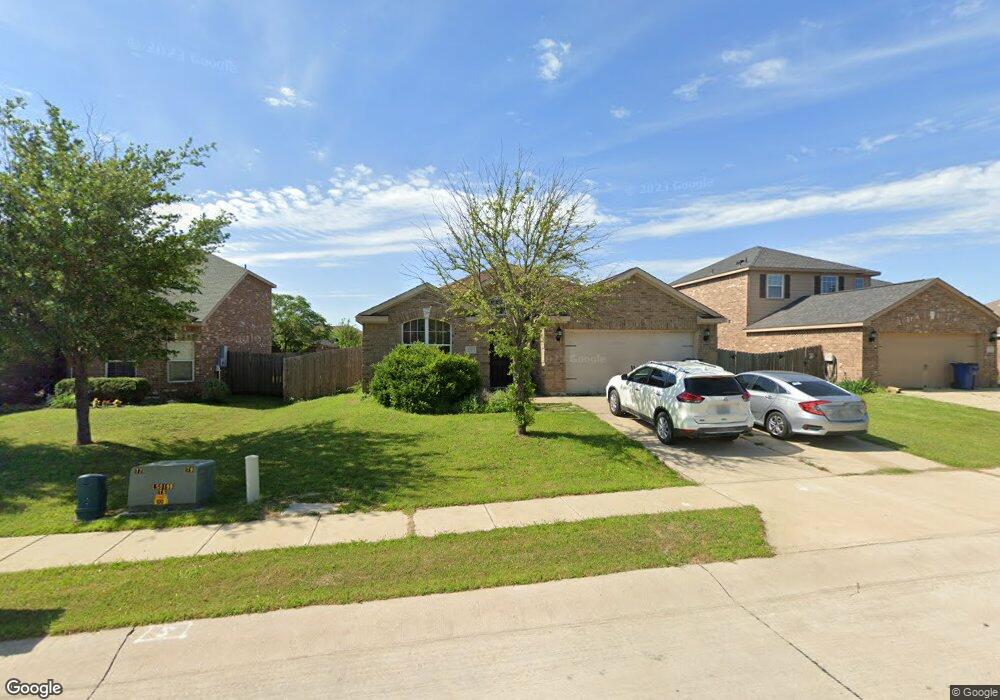
126 Eider Dr Sanger, TX 76266
Estimated Value: $265,531 - $307,000
3
Beds
2
Baths
1,491
Sq Ft
$194/Sq Ft
Est. Value
About This Home
This home is located at 126 Eider Dr, Sanger, TX 76266 and is currently estimated at $289,883, approximately $194 per square foot. 126 Eider Dr is a home located in Denton County with nearby schools including Chisholm Trail Elementary School, Clear Creek Intermediate School, and Sanger Sixth Grade Campus.
Ownership History
Date
Name
Owned For
Owner Type
Purchase Details
Closed on
May 21, 2018
Sold by
Kssms Llc
Bought by
Pope Janet Lee and Pope Nathaniel Griffin
Current Estimated Value
Home Financials for this Owner
Home Financials are based on the most recent Mortgage that was taken out on this home.
Original Mortgage
$180,420
Outstanding Balance
$155,348
Interest Rate
4.4%
Mortgage Type
New Conventional
Estimated Equity
$134,535
Purchase Details
Closed on
Nov 6, 2017
Sold by
Myatt Tamra
Bought by
Allen And Brigham Investments Llc
Purchase Details
Closed on
Jul 12, 2012
Sold by
Lgi Homes Quail Run Llc
Bought by
Myatt Tamra
Home Financials for this Owner
Home Financials are based on the most recent Mortgage that was taken out on this home.
Original Mortgage
$5,337
Interest Rate
3.72%
Mortgage Type
Stand Alone Second
Create a Home Valuation Report for This Property
The Home Valuation Report is an in-depth analysis detailing your home's value as well as a comparison with similar homes in the area
Home Values in the Area
Average Home Value in this Area
Purchase History
| Date | Buyer | Sale Price | Title Company |
|---|---|---|---|
| Pope Janet Lee | -- | Chicago Title Of Texas | |
| Allen And Brigham Investments Llc | -- | None Available | |
| Myatt Tamra | -- | Texas American Title Company |
Source: Public Records
Mortgage History
| Date | Status | Borrower | Loan Amount |
|---|---|---|---|
| Open | Pope Janet Lee | $180,420 | |
| Previous Owner | Myatt Tamra | $5,337 | |
| Previous Owner | Myatt Tamra | $133,438 |
Source: Public Records
Tax History
| Year | Tax Paid | Tax Assessment Tax Assessment Total Assessment is a certain percentage of the fair market value that is determined by local assessors to be the total taxable value of land and additions on the property. | Land | Improvement |
|---|---|---|---|---|
| 2025 | $4,415 | $288,387 | $69,300 | $219,087 |
| 2024 | $5,568 | $275,505 | $0 | $0 |
| 2023 | $3,919 | $250,459 | $56,700 | $232,698 |
| 2022 | $5,049 | $227,690 | $56,700 | $181,218 |
| 2021 | $4,350 | $206,991 | $45,675 | $161,316 |
| 2020 | $4,242 | $191,702 | $38,493 | $153,209 |
| 2019 | $4,280 | $188,000 | $38,493 | $149,507 |
| 2018 | $3,788 | $165,490 | $38,493 | $126,997 |
| 2017 | $3,643 | $158,405 | $38,493 | $119,912 |
| 2016 | $3,438 | $149,480 | $38,493 | $112,394 |
| 2015 | $3,181 | $135,891 | $24,192 | $111,699 |
| 2013 | -- | $134,511 | $24,192 | $110,319 |
Source: Public Records
Map
Nearby Homes
- 124 Morning Glory
- 113 Kincaid Dr
- 136 Eider Dr
- 921 First St
- 185 Aster Dr
- 188 Aster Dr
- 140 Ringneck Dr
- 0000 Rector Rd
- 117 Teal Rd
- 307 Quail Crossing Dr
- 319 Quail Crossing Dr
- 1012 Cowling Rd
- 226 Hillcrest St
- 505 Houston St
- TBD Railroad Ave
- 113 Diane Dr
- 117 Kathryn Dr
- 315 Jones St
- 223 Jones St
- 2000 S Stemmons St
Your Personal Tour Guide
Ask me questions while you tour the home.