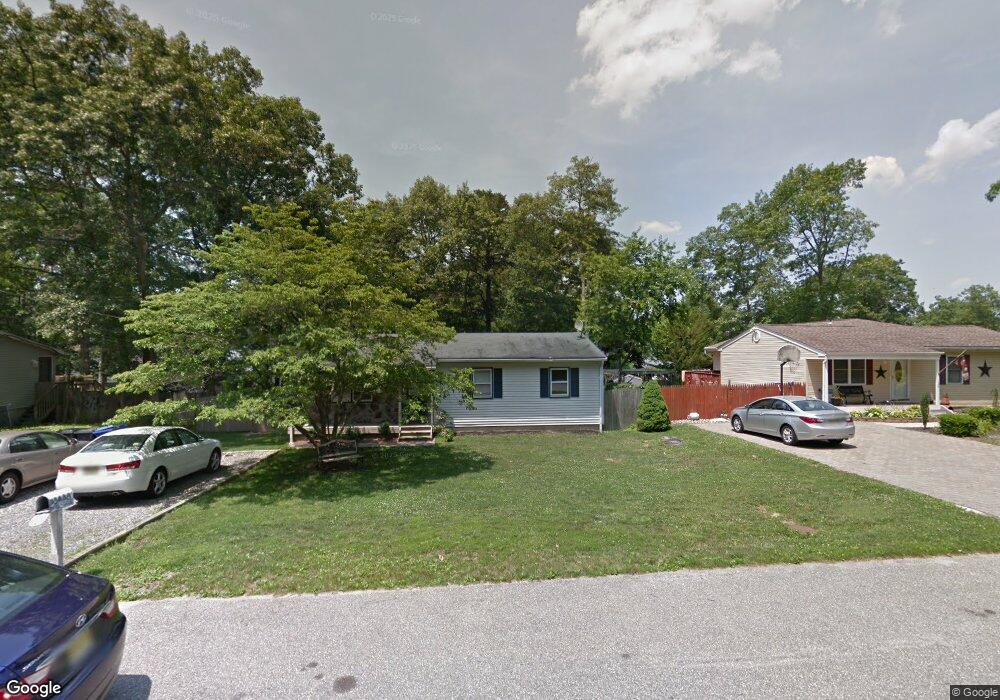
126 Flipper Ave Manahawkin, NJ 08050
Stafford NeighborhoodEstimated Value: $382,787 - $409,000
3
Beds
1
Bath
1,008
Sq Ft
$395/Sq Ft
Est. Value
About This Home
This home is located at 126 Flipper Ave, Manahawkin, NJ 08050 and is currently estimated at $397,697, approximately $394 per square foot. 126 Flipper Ave is a home located in Ocean County with nearby schools including Ocean Acres Elementary School, Oxycocus Elementary School, and McKinley Avenue Elementary School.
Ownership History
Date
Name
Owned For
Owner Type
Purchase Details
Closed on
Dec 22, 2005
Sold by
Seibel Sarah J
Bought by
Boehler William J
Current Estimated Value
Home Financials for this Owner
Home Financials are based on the most recent Mortgage that was taken out on this home.
Original Mortgage
$47,000
Outstanding Balance
$1,031
Interest Rate
6.39%
Mortgage Type
Stand Alone Second
Estimated Equity
$396,666
Purchase Details
Closed on
Sep 26, 2002
Sold by
Colyer Barbara Moore
Bought by
Cione Nicholas and Brennan Jennifer
Home Financials for this Owner
Home Financials are based on the most recent Mortgage that was taken out on this home.
Original Mortgage
$140,044
Interest Rate
6.2%
Mortgage Type
FHA
Purchase Details
Closed on
Aug 20, 1999
Sold by
Deacon Robert R and Deacon Loretta
Bought by
Moore Barbara
Home Financials for this Owner
Home Financials are based on the most recent Mortgage that was taken out on this home.
Original Mortgage
$72,290
Interest Rate
7.53%
Mortgage Type
FHA
Create a Home Valuation Report for This Property
The Home Valuation Report is an in-depth analysis detailing your home's value as well as a comparison with similar homes in the area
Home Values in the Area
Average Home Value in this Area
Purchase History
| Date | Buyer | Sale Price | Title Company |
|---|---|---|---|
| Boehler William J | $235,000 | Lawyers Title Ins | |
| Cione Nicholas | $142,500 | -- | |
| Moore Barbara | $74,500 | -- |
Source: Public Records
Mortgage History
| Date | Status | Borrower | Loan Amount |
|---|---|---|---|
| Open | Boehler William J | $47,000 | |
| Previous Owner | Cione Nicholas | $140,044 | |
| Previous Owner | Moore Barbara | $72,290 |
Source: Public Records
Tax History Compared to Growth
Tax History
| Year | Tax Paid | Tax Assessment Tax Assessment Total Assessment is a certain percentage of the fair market value that is determined by local assessors to be the total taxable value of land and additions on the property. | Land | Improvement |
|---|---|---|---|---|
| 2025 | $3,665 | $147,600 | $61,600 | $86,000 |
| 2024 | $3,629 | $147,600 | $61,600 | $86,000 |
| 2023 | $3,475 | $147,600 | $61,600 | $86,000 |
| 2022 | $3,475 | $147,600 | $61,600 | $86,000 |
| 2021 | $3,427 | $147,600 | $61,600 | $86,000 |
| 2020 | $3,432 | $147,600 | $61,600 | $86,000 |
| 2019 | $3,383 | $147,600 | $61,600 | $86,000 |
| 2018 | $3,362 | $147,600 | $61,600 | $86,000 |
| 2017 | $3,297 | $140,100 | $61,600 | $78,500 |
| 2016 | $3,263 | $140,100 | $61,600 | $78,500 |
| 2015 | $3,148 | $140,100 | $61,600 | $78,500 |
| 2014 | $3,110 | $136,700 | $60,800 | $75,900 |
Source: Public Records
Map
Nearby Homes
- 139 Mermaid Dr
- 58 Flipper Ave
- 1215 Canal Ave
- 1174 Treasure Ave
- 182 Atlantis Ave
- 1208 Windlass Dr
- 100 Marlin Rd
- 1174 Steamer Ave
- 1195 Windlass Dr
- 1604, 1608, 1612 W Route 72 Hwy
- 248 Matey Ave
- 246 Atlantis Ave
- 101 Topsail Ln
- 296 Nautilus Dr
- 117 Topside Rd
- 1173 Barnacle Dr
- 1073 Cutlass Ave
- 309 Neptune Dr
- 296 Neptune Dr
- 135 Nautilus Dr
- 122 Flipper Ave
- 130 Flipper Ave
- 1506 Forecastle Ave
- 1502 Forecastle Ave
- 1510 Forecastle Ave
- 118 Flipper Ave
- 134 Flipper Ave
- 127 Flipper Ave
- 131 Flipper Ave
- 123 Flipper Ave
- 1498 Forecastle Ave
- 1514 Forecastle Ave
- 114 Flipper Ave
- 119 Flipper Ave
- 135 Flipper Ave
- 142 Flipper Ave
- 1494 Forecastle Ave
- 1518 Forecastle Ave
- 115 Flipper Ave
- 126 Mermaid Dr