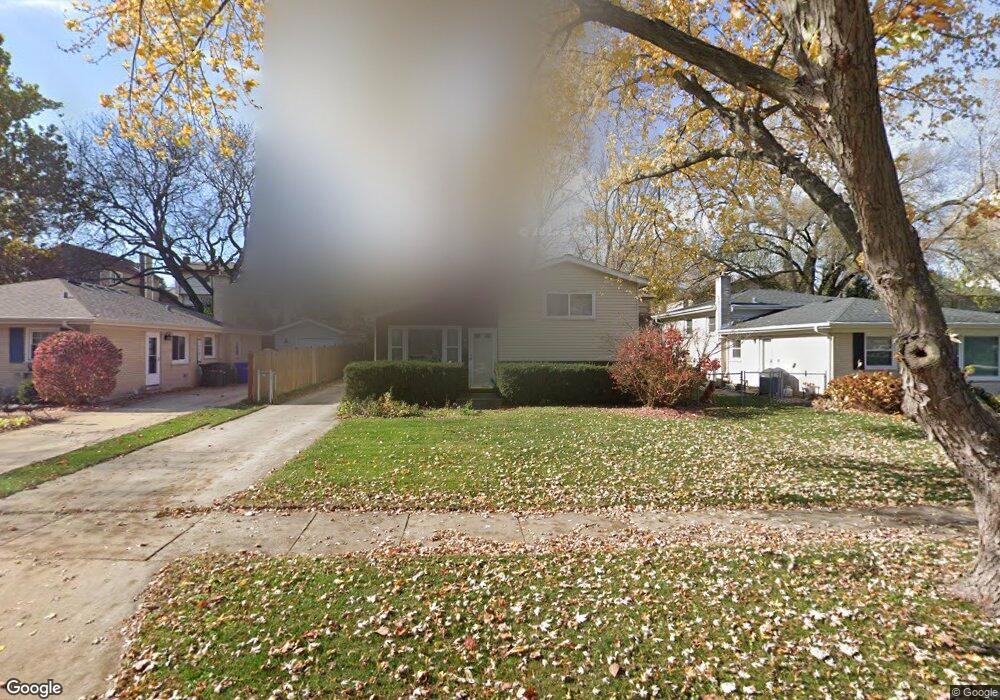
126 Grove Ave Glen Ellyn, IL 60137
Estimated Value: $364,000 - $408,000
3
Beds
1
Bath
1,036
Sq Ft
$373/Sq Ft
Est. Value
About This Home
This home is located at 126 Grove Ave, Glen Ellyn, IL 60137 and is currently estimated at $385,946, approximately $372 per square foot. 126 Grove Ave is a home located in DuPage County with nearby schools including Park View Elementary School, Glen Crest Middle School, and Glenbard South High School.
Ownership History
Date
Name
Owned For
Owner Type
Purchase Details
Closed on
Jan 18, 2018
Sold by
Hostetler Real Estate Group L P
Bought by
Hostetler Noelle G and The Errol Hostetler Family Trust
Current Estimated Value
Purchase Details
Closed on
Oct 14, 2005
Sold by
Ostrowska Spiewak Alicja and Kedzior Sebastian B
Bought by
Hostetler Real Estate Group Lp
Purchase Details
Closed on
Jun 15, 2001
Sold by
Delguidice Joseph and Delguidice Melanie
Bought by
Kedzior Sebastian B and Kedzior Agnieszka
Home Financials for this Owner
Home Financials are based on the most recent Mortgage that was taken out on this home.
Original Mortgage
$180,500
Interest Rate
7.11%
Purchase Details
Closed on
Dec 28, 1995
Sold by
Fatemi Badi Seyed Mohammad and Fatemi Badi Tamara R
Bought by
Delgiudice Joseph and Doshen Melanie
Home Financials for this Owner
Home Financials are based on the most recent Mortgage that was taken out on this home.
Original Mortgage
$100,000
Interest Rate
7.28%
Create a Home Valuation Report for This Property
The Home Valuation Report is an in-depth analysis detailing your home's value as well as a comparison with similar homes in the area
Home Values in the Area
Average Home Value in this Area
Purchase History
| Date | Buyer | Sale Price | Title Company |
|---|---|---|---|
| Hostetler Noelle G | -- | Attorney | |
| Hostetler Real Estate Group Lp | $272,500 | First American Title Ins Co | |
| Kedzior Sebastian B | $190,000 | Chicago Title Insurance Co | |
| Delgiudice Joseph | $141,500 | -- |
Source: Public Records
Mortgage History
| Date | Status | Borrower | Loan Amount |
|---|---|---|---|
| Previous Owner | Kedzior Sebastian B | $180,500 | |
| Previous Owner | Delgiudice Joseph | $100,000 |
Source: Public Records
Tax History Compared to Growth
Tax History
| Year | Tax Paid | Tax Assessment Tax Assessment Total Assessment is a certain percentage of the fair market value that is determined by local assessors to be the total taxable value of land and additions on the property. | Land | Improvement |
|---|---|---|---|---|
| 2024 | $7,104 | $96,059 | $22,988 | $73,071 |
| 2023 | $6,793 | $88,420 | $21,160 | $67,260 |
| 2022 | $6,392 | $83,560 | $19,990 | $63,570 |
| 2021 | $5,737 | $81,580 | $19,520 | $62,060 |
| 2020 | $5,754 | $80,820 | $19,340 | $61,480 |
| 2019 | $5,607 | $78,690 | $18,830 | $59,860 |
| 2018 | $4,759 | $67,160 | $17,760 | $49,400 |
| 2017 | $4,399 | $64,680 | $17,100 | $47,580 |
| 2016 | $4,366 | $62,100 | $16,420 | $45,680 |
| 2015 | $4,339 | $59,240 | $15,660 | $43,580 |
| 2014 | $4,430 | $59,290 | $15,720 | $43,570 |
| 2013 | $4,290 | $59,470 | $15,770 | $43,700 |
Source: Public Records
Map
Nearby Homes
- 153 Grove Ave
- 953 Oxford Rd
- 61 Grove Ave
- 130 Tanglewood Dr
- 82 Valley Rd
- 243 Bryant Ave
- 832 N Driveway
- 14931 Parkview Blvd
- 734 Highview Ave
- 21W230 Pershing Ave
- 725 Kingsbrook Glen
- 670 Revere Rd
- 789 Hill Ave
- 1S217 Valley Rd
- 83 N Park Blvd
- 143 Harding Ct
- 131 Harding Ct
- 129 Harding Ct
- 397 Taylor Ave
- 449 Longfellow Ave