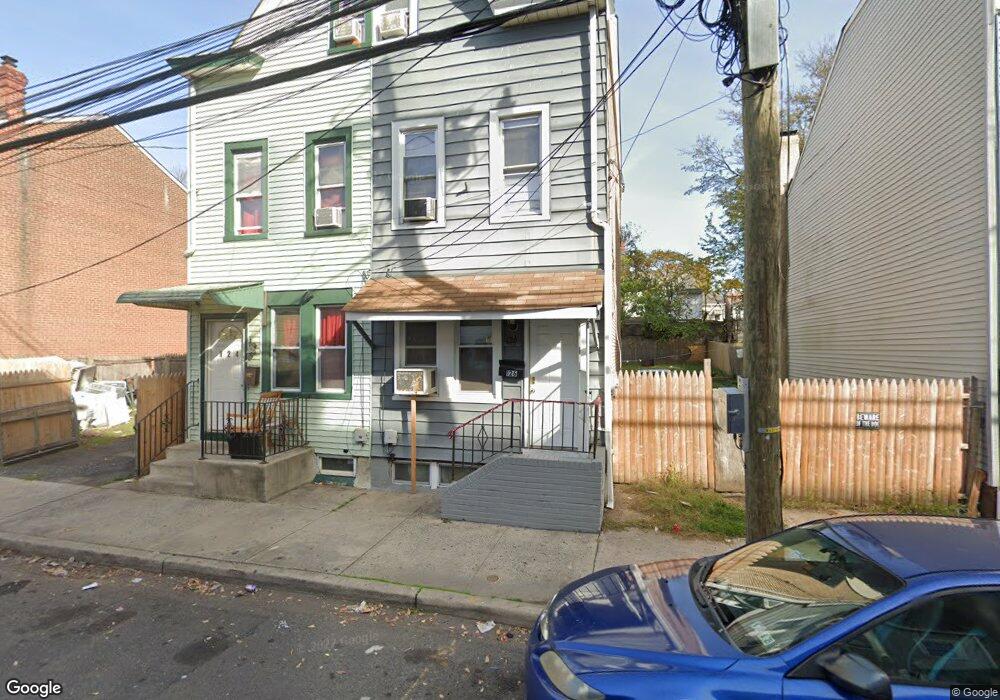
126 Hancock St Trenton, NJ 08611
South Trenton NeighborhoodEstimated Value: $163,000 - $199,000
5
Beds
1
Bath
1,044
Sq Ft
$170/Sq Ft
Est. Value
About This Home
This home is located at 126 Hancock St, Trenton, NJ 08611 and is currently estimated at $177,289, approximately $169 per square foot. 126 Hancock St is a home located in Mercer County with nearby schools including Mott Elementary School, Parker Elementary School, and Dr. Crosby Copeland Elementary School.
Ownership History
Date
Name
Owned For
Owner Type
Purchase Details
Closed on
Apr 3, 2025
Sold by
Emerald Management Group Inc
Bought by
Bendel Properties Llc
Current Estimated Value
Home Financials for this Owner
Home Financials are based on the most recent Mortgage that was taken out on this home.
Original Mortgage
$197,200
Outstanding Balance
$196,343
Interest Rate
6.76%
Mortgage Type
Construction
Estimated Equity
-$19,054
Purchase Details
Closed on
Dec 12, 2008
Create a Home Valuation Report for This Property
The Home Valuation Report is an in-depth analysis detailing your home's value as well as a comparison with similar homes in the area
Home Values in the Area
Average Home Value in this Area
Purchase History
| Date | Buyer | Sale Price | Title Company |
|---|---|---|---|
| Bendel Properties Llc | $183,000 | First American Title | |
| Bendel Properties Llc | $183,000 | First American Title | |
| -- | $41,700 | -- | |
| Emerald Management Group Inc | $41,666 | Sterling Title Agency |
Source: Public Records
Mortgage History
| Date | Status | Borrower | Loan Amount |
|---|---|---|---|
| Open | Bendel Properties Llc | $197,200 | |
| Closed | Bendel Properties Llc | $197,200 |
Source: Public Records
Tax History Compared to Growth
Tax History
| Year | Tax Paid | Tax Assessment Tax Assessment Total Assessment is a certain percentage of the fair market value that is determined by local assessors to be the total taxable value of land and additions on the property. | Land | Improvement |
|---|---|---|---|---|
| 2025 | $2,813 | $48,500 | $8,400 | $40,100 |
| 2024 | $2,700 | $48,500 | $8,400 | $40,100 |
| 2023 | $2,700 | $48,500 | $8,400 | $40,100 |
| 2022 | $2,647 | $48,500 | $8,400 | $40,100 |
| 2021 | $2,693 | $48,500 | $8,400 | $40,100 |
| 2020 | $2,684 | $48,500 | $8,400 | $40,100 |
| 2019 | $2,641 | $48,500 | $8,400 | $40,100 |
| 2018 | $2,528 | $48,500 | $8,400 | $40,100 |
| 2017 | $2,403 | $48,500 | $8,400 | $40,100 |
| 2016 | $2,324 | $40,400 | $14,900 | $25,500 |
| 2015 | $2,316 | $40,400 | $14,900 | $25,500 |
| 2014 | $2,305 | $40,400 | $14,900 | $25,500 |
Source: Public Records
Map
Nearby Homes