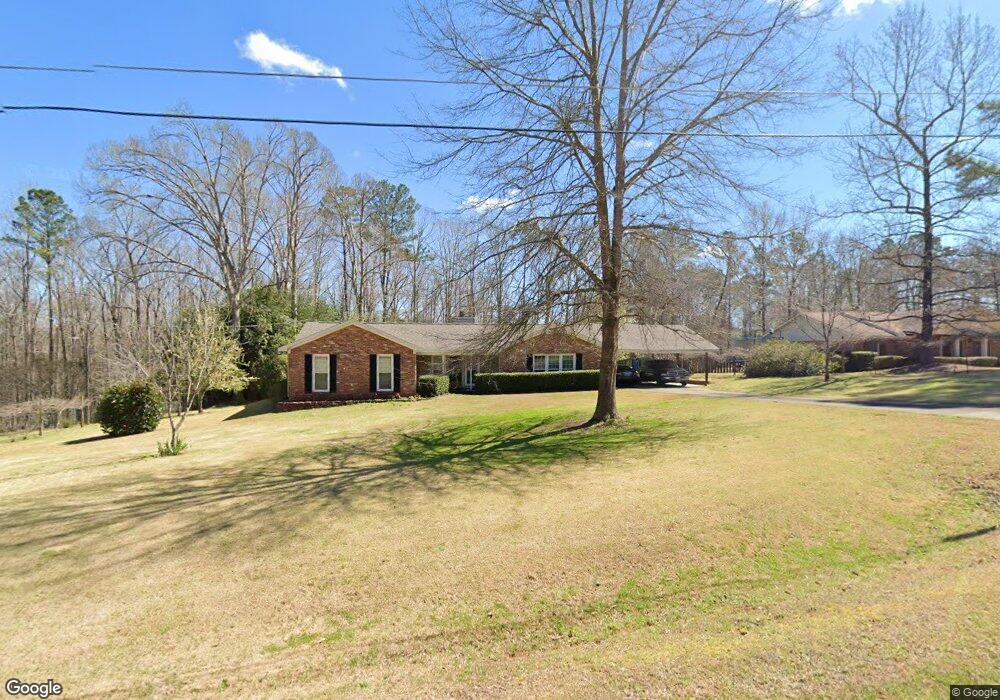
126 Hazel Way Lagrange, GA 30241
Estimated Value: $236,010 - $267,000
3
Beds
2
Baths
1,632
Sq Ft
$152/Sq Ft
Est. Value
About This Home
This home is located at 126 Hazel Way, Lagrange, GA 30241 and is currently estimated at $248,253, approximately $152 per square foot. 126 Hazel Way is a home located in Troup County with nearby schools including Callaway Elementary School, Hogansville Elementary School, and Callaway Middle School.
Ownership History
Date
Name
Owned For
Owner Type
Purchase Details
Closed on
Aug 16, 1994
Sold by
Margia Glenn Boykin By Ex
Bought by
Boykin Henry Lewis
Current Estimated Value
Purchase Details
Closed on
Jun 28, 1991
Sold by
James Milward and James Gladys M
Bought by
Margia Glenn Boykin By Ex
Purchase Details
Closed on
Jun 8, 1989
Sold by
Milwardl James
Bought by
James Milward and James Gladys M
Purchase Details
Closed on
Jun 7, 1989
Sold by
Plunkett Michael W and Plunkett Susan W
Bought by
Milwardl James
Purchase Details
Closed on
Aug 28, 1980
Sold by
Forkey Terry A and Forkey Linda B
Bought by
Plunkett Michael W and Plunkett Susan W
Purchase Details
Closed on
Jun 6, 1977
Sold by
The Beclin Co Inc
Bought by
Forkey Terry A and Forkey Linda B
Purchase Details
Closed on
Sep 23, 1976
Sold by
Daniel Lumber Co
Bought by
The Beclin Co Inc
Purchase Details
Closed on
Sep 22, 1976
Sold by
Joe C Thomas
Bought by
Daniel Lumber Co
Create a Home Valuation Report for This Property
The Home Valuation Report is an in-depth analysis detailing your home's value as well as a comparison with similar homes in the area
Purchase History
| Date | Buyer | Sale Price | Title Company |
|---|---|---|---|
| Boykin Henry Lewis | -- | -- | |
| Margia Glenn Boykin By Ex | $68,500 | -- | |
| James Milward | -- | -- | |
| Milwardl James | $66,500 | -- | |
| Plunkett Michael W | -- | -- | |
| Forkey Terry A | -- | -- | |
| The Beclin Co Inc | -- | -- | |
| Daniel Lumber Co | -- | -- |
Source: Public Records
Tax History
| Year | Tax Paid | Tax Assessment Tax Assessment Total Assessment is a certain percentage of the fair market value that is determined by local assessors to be the total taxable value of land and additions on the property. | Land | Improvement |
|---|---|---|---|---|
| 2025 | $2,219 | $84,360 | $10,000 | $74,360 |
| 2024 | $2,168 | $81,480 | $10,000 | $71,480 |
| 2023 | $2,245 | $84,320 | $10,000 | $74,320 |
| 2022 | $2,087 | $76,760 | $10,000 | $66,760 |
| 2021 | $1,648 | $56,640 | $8,000 | $48,640 |
| 2020 | $1,648 | $56,640 | $8,000 | $48,640 |
| 2019 | $1,283 | $44,520 | $4,800 | $39,720 |
| 2018 | $1,103 | $38,560 | $5,000 | $33,560 |
| 2017 | $1,103 | $38,560 | $5,000 | $33,560 |
| 2016 | $1,072 | $37,530 | $5,000 | $32,530 |
| 2015 | $1,072 | $37,530 | $5,000 | $32,530 |
| 2014 | $1,021 | $35,817 | $5,000 | $30,817 |
| 2013 | -- | $36,447 | $5,000 | $31,447 |
Source: Public Records
Map
Nearby Homes
- 10 Whitfield Rd
- SMOKEMONT Smokemont Dr
- 883 Hammett Rd
- 789 Hammett Rd
- 119 Sir Lancelot St
- 300 Old Pond Rd
- 124 Woodridge Cir
- 425 Mount Zion Church Rd
- 200 Freshwater Ct Unit 37
- 234 River Meadow Dr
- 202 Freshwater Ct Unit E36
- 202 Freshwater Ct
- 402 Sweetwood Ct Unit LOT 2
- 204 Freshwater Ct
- 206 Freshwater Ct Unit 34E
- 206 Freshwater Ct
- 200 River Meadow Dr
- 124 Shenandoah Ln
- 105 Ridgefield Dr
- 114 Shenandoah Ln
- 124 Hazel Way
- 128 Hazel Way
- 113 Wolverine Ct
- 122 Hazel Way
- 122 Hazel Way Unit 19
- 130 Hazel Way
- 127 Hazel Way
- 129 Hazel Way
- 123 Hazel Way
- 111 Wolverine Ct
- 125 Hazel Way
- 110 Wolverine Ct
- 104 Wolverine Ct
- 120 Hazel Way
- 121 Hazel Way
- 132 Hazel Way
- 137 Hazel Way
- 109 Wolverine Ct
- 134 Hazel Way
- 108 Wolverine Ct
Your Personal Tour Guide
Ask me questions while you tour the home.