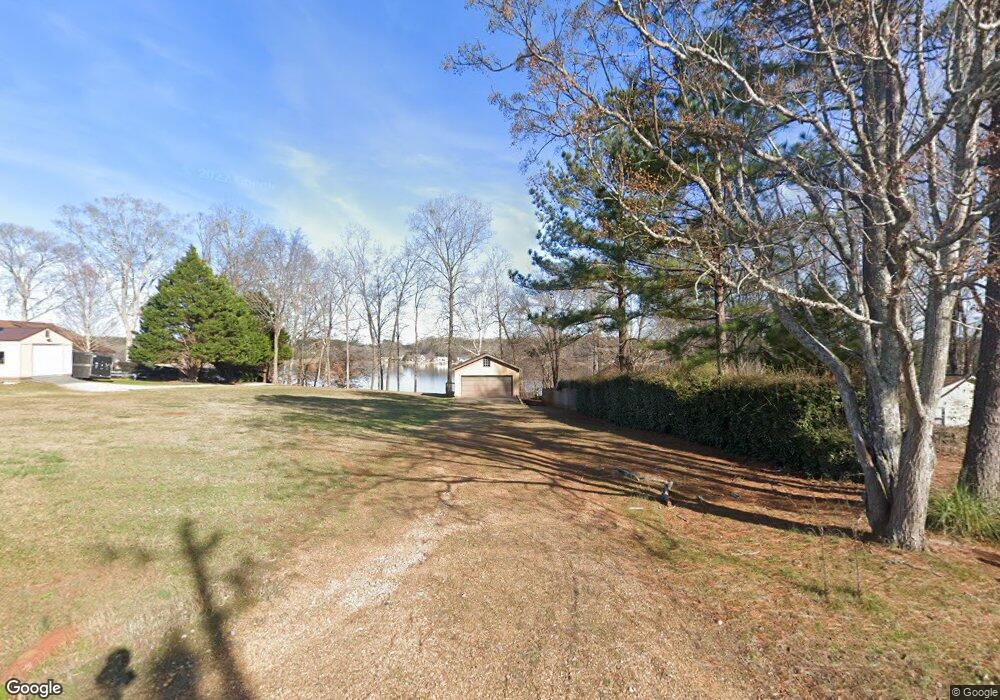
126 Hoot Owl Ln Eatonton, GA 31024
Estimated Value: $733,000 - $1,315,000
--
Bed
1
Bath
1,922
Sq Ft
$543/Sq Ft
Est. Value
About This Home
This home is located at 126 Hoot Owl Ln, Eatonton, GA 31024 and is currently estimated at $1,043,975, approximately $543 per square foot. 126 Hoot Owl Ln is a home located in Putnam County with nearby schools including Putnam County Primary School, Putnam County Elementary School, and Putnam County Middle School.
Ownership History
Date
Name
Owned For
Owner Type
Purchase Details
Closed on
Mar 24, 2021
Sold by
Rager Randall Paul
Bought by
Fender William G and Fender Ginger
Current Estimated Value
Home Financials for this Owner
Home Financials are based on the most recent Mortgage that was taken out on this home.
Original Mortgage
$175,000
Outstanding Balance
$18,662
Interest Rate
2.9%
Mortgage Type
New Conventional
Estimated Equity
$1,025,313
Purchase Details
Closed on
Jan 16, 2019
Sold by
Crowley Michael Wayne
Bought by
Rager Randall Paul and J & J Revocable Trust
Purchase Details
Closed on
Nov 4, 1999
Sold by
Knight Darris E
Bought by
Crowleys Caseworks
Purchase Details
Closed on
Jul 13, 1999
Sold by
Adams Alan J
Bought by
Knight Darris E
Purchase Details
Closed on
Jun 13, 1997
Sold by
Adams Alan J
Bought by
Adams Alan J
Purchase Details
Closed on
May 15, 1997
Sold by
Nuckolls Land Develo
Bought by
Adams Alan J
Create a Home Valuation Report for This Property
The Home Valuation Report is an in-depth analysis detailing your home's value as well as a comparison with similar homes in the area
Home Values in the Area
Average Home Value in this Area
Purchase History
| Date | Buyer | Sale Price | Title Company |
|---|---|---|---|
| Fender William G | $282,500 | -- | |
| Rager Randall Paul | $265,000 | -- | |
| Crowleys Caseworks | $85,000 | -- | |
| Knight Darris E | $40,000 | -- | |
| Adams Alan J | $18,500 | -- | |
| Adams Alan J | $37,000 | -- |
Source: Public Records
Mortgage History
| Date | Status | Borrower | Loan Amount |
|---|---|---|---|
| Open | Fender William G | $175,000 |
Source: Public Records
Tax History Compared to Growth
Tax History
| Year | Tax Paid | Tax Assessment Tax Assessment Total Assessment is a certain percentage of the fair market value that is determined by local assessors to be the total taxable value of land and additions on the property. | Land | Improvement |
|---|---|---|---|---|
| 2024 | $4,653 | $270,141 | $100,000 | $170,141 |
| 2023 | $2,672 | $148,041 | $132,000 | $16,041 |
| 2022 | $2,256 | $112,354 | $100,000 | $12,354 |
| 2021 | $2,567 | $112,641 | $100,000 | $12,641 |
| 2020 | $2,471 | $103,072 | $90,000 | $13,072 |
| 2019 | $2,546 | $101,821 | $90,000 | $11,821 |
| 2018 | $2,444 | $97,851 | $90,000 | $7,851 |
| 2017 | $2,206 | $97,851 | $90,000 | $7,851 |
| 2016 | $2,209 | $97,851 | $90,000 | $7,851 |
| 2015 | $2,083 | $95,760 | $90,000 | $5,760 |
| 2014 | $2,086 | $95,760 | $90,000 | $5,760 |
Source: Public Records
Map
Nearby Homes
- 124 Hoot Owl Ln
- 156 Hoot Owl Ln
- 161 Hoot Owl Ln
- 905 (Unit 208) Greensboro Rd
- 905 Greensboro Rd
- 905 Greensboro Rd Unit 106
- 118 Lake Dr
- 930 Lake Oconee Pkwy Unit 322
- 930 Lake Oconee Pkwy
- 930 Lake Oconee Pkwy Unit 320
- 171 Farriers Ln
- 136 N Hidden Lake Dr
- 181 Farriers Ln
- 146 Misty Ln
- 121 Alexander Lakes Dr
- 121 Alexander Lakes Dr Unit 121
- 130 Hoot Owl Ln
- 120 Hoot Owl Ln
- 165 Hoot Owl Ln
- 125 Hoot Owl Ln
- 131 Hoot Owl Ln Unit 35
- 131 Hoot Owl Ln
- 129 Hoot Owl Ln Unit 34
- 129 Hoot Owl Ln
- 159 Hoot Owl Ln Unit 9
- 159 Hoot Owl Ln
- 133 Hoot Owl Ln
- 118 Hoot Owl Ln
- 157 Hoot Owl Ln Unit 8
- 157 Hoot Owl Ln
- 134 Hoot Owl Ln
- 204 Beaver Rd
- Lot 9 Hoot Owl Ln
- Lt 13 Hoot Owl Ln
- Lot 13 Hoot Owl Ln
- 21 Hoot Owl Ln Unit Lot 21