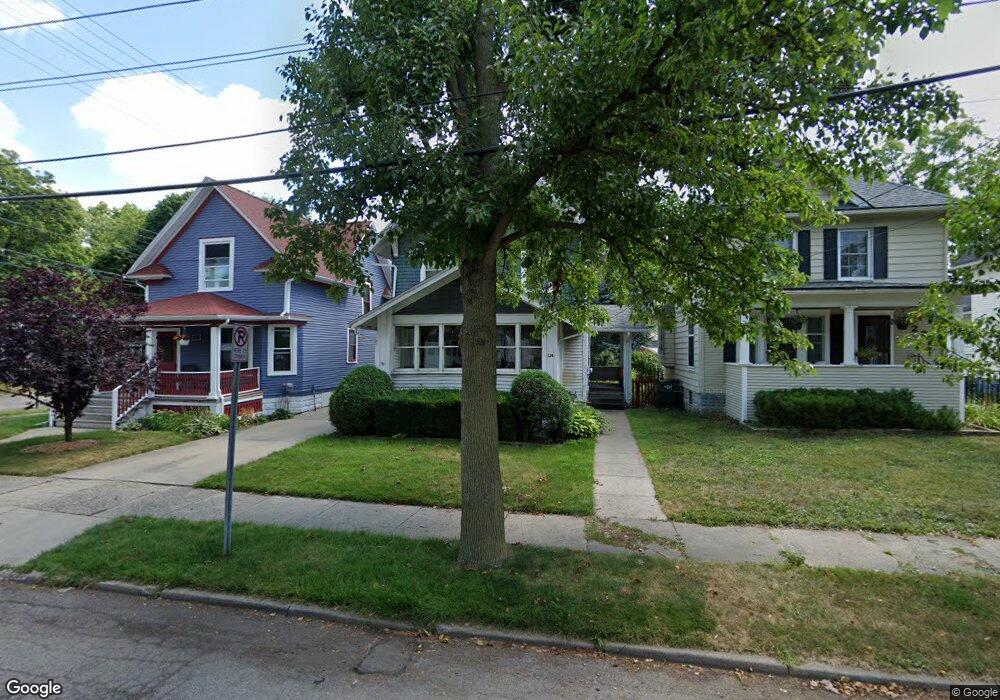
126 Horton St Lansing, MI 48912
Eastfield NeighborhoodEstimated Value: $150,724 - $170,000
Studio
--
Bath
1,452
Sq Ft
$111/Sq Ft
Est. Value
About This Home
This home is located at 126 Horton St, Lansing, MI 48912 and is currently estimated at $161,431, approximately $111 per square foot. 126 Horton St is a home located in Ingham County with nearby schools including Pattengill Academy, Riddle Elementary School, and Eastern High School.
Ownership History
Date
Name
Owned For
Owner Type
Purchase Details
Closed on
Feb 24, 2003
Sold by
Kusk Jens and Kusk Else M
Bought by
Kusk Rolf
Current Estimated Value
Home Financials for this Owner
Home Financials are based on the most recent Mortgage that was taken out on this home.
Original Mortgage
$66,000
Outstanding Balance
$28,746
Interest Rate
6.06%
Mortgage Type
Purchase Money Mortgage
Estimated Equity
$132,685
Purchase Details
Closed on
May 1, 1995
Create a Home Valuation Report for This Property
The Home Valuation Report is an in-depth analysis detailing your home's value as well as a comparison with similar homes in the area
Home Values in the Area
Average Home Value in this Area
Purchase History
| Date | Buyer | Sale Price | Title Company |
|---|---|---|---|
| Kusk Rolf | -- | Transnation Title | |
| -- | $61,100 | -- |
Source: Public Records
Mortgage History
| Date | Status | Borrower | Loan Amount |
|---|---|---|---|
| Open | Kusk Rolf | $66,000 |
Source: Public Records
Tax History
| Year | Tax Paid | Tax Assessment Tax Assessment Total Assessment is a certain percentage of the fair market value that is determined by local assessors to be the total taxable value of land and additions on the property. | Land | Improvement |
|---|---|---|---|---|
| 2025 | $2,967 | $78,700 | $5,600 | $73,100 |
| 2024 | $23 | $68,000 | $5,600 | $62,400 |
| 2023 | $2,782 | $62,000 | $5,600 | $56,400 |
| 2022 | $2,508 | $58,000 | $4,800 | $53,200 |
| 2021 | $2,456 | $52,900 | $4,000 | $48,900 |
| 2020 | $2,441 | $49,800 | $4,000 | $45,800 |
| 2019 | $2,340 | $45,700 | $4,000 | $41,700 |
| 2018 | $2,193 | $42,000 | $4,000 | $38,000 |
| 2017 | $2,099 | $42,000 | $4,000 | $38,000 |
| 2016 | $2,016 | $37,800 | $4,000 | $33,800 |
| 2015 | $2,016 | $36,100 | $8,009 | $28,091 |
| 2014 | $2,016 | $35,700 | $7,369 | $28,331 |
Source: Public Records
Map
Nearby Homes
- 228 Marshall St
- 1713 Stanley Ct
- 218 N Magnolia Ave Unit 1
- 311 N Magnolia Ave
- 121 Lathrop St
- 129 Clifford St
- 605 N Clemens Ave
- 605 N Fairview Ave
- 421 S Clemens Ave
- 404 S Hayford Ave
- 129 S Francis Ave
- 1346 Eureka St
- 133 S Francis Ave
- 135 S Francis Ave
- 400 Lathrop St
- 508 Leslie St
- 411 S Hayford Ave
- 517 S Clemens Ave
- 224 Mifflin Ave
- 528 S Fairview Ave
Your Personal Tour Guide
Ask me questions while you tour the home.