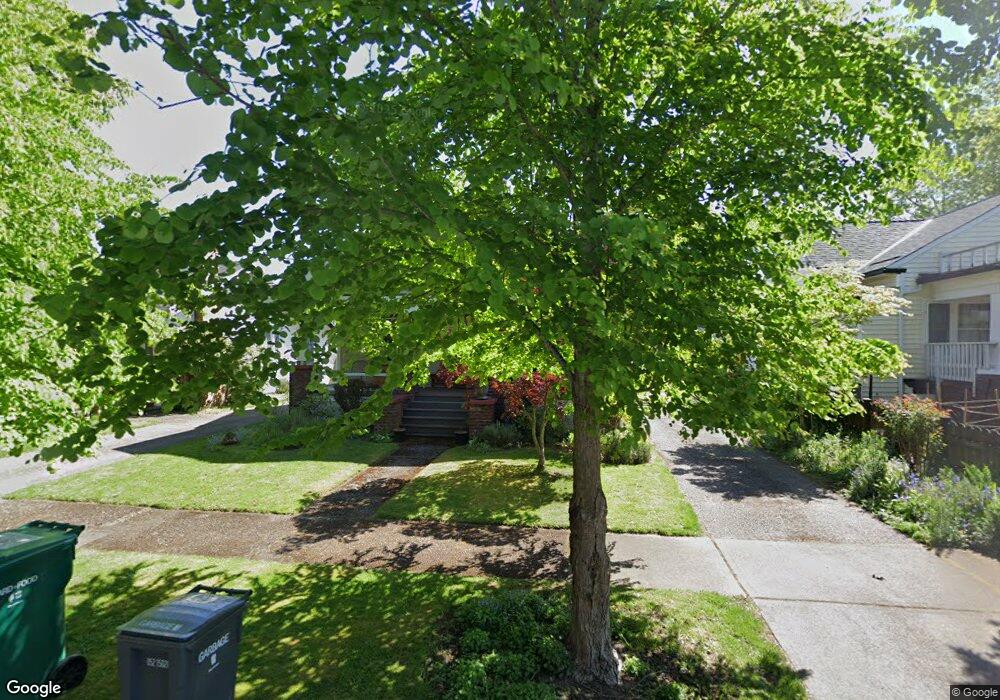
126 I St SE Auburn, WA 98002
Downtown Auburn NeighborhoodEstimated Value: $417,000 - $493,000
2
Beds
1
Bath
1,090
Sq Ft
$418/Sq Ft
Est. Value
About This Home
This home is located at 126 I St SE, Auburn, WA 98002 and is currently estimated at $456,049, approximately $418 per square foot. 126 I St SE is a home located in King County with nearby schools including Washington Elementary School, Cascade Middle School, and Auburn High School.
Ownership History
Date
Name
Owned For
Owner Type
Purchase Details
Closed on
Oct 10, 2002
Sold by
Pierson Gary
Bought by
Pierson Gary and Roth Susan
Current Estimated Value
Home Financials for this Owner
Home Financials are based on the most recent Mortgage that was taken out on this home.
Original Mortgage
$142,350
Interest Rate
5.46%
Purchase Details
Closed on
Mar 16, 2001
Sold by
Spencer Susan L and Chase Joyce L
Bought by
Pierson Gary
Home Financials for this Owner
Home Financials are based on the most recent Mortgage that was taken out on this home.
Original Mortgage
$139,500
Interest Rate
7.19%
Purchase Details
Closed on
Apr 20, 1999
Sold by
Spencer David and Spencer Susan L
Bought by
Spencer Susan L
Home Financials for this Owner
Home Financials are based on the most recent Mortgage that was taken out on this home.
Original Mortgage
$97,500
Interest Rate
6.98%
Create a Home Valuation Report for This Property
The Home Valuation Report is an in-depth analysis detailing your home's value as well as a comparison with similar homes in the area
Home Values in the Area
Average Home Value in this Area
Purchase History
| Date | Buyer | Sale Price | Title Company |
|---|---|---|---|
| Pierson Gary | -- | First American | |
| Pierson Gary | $155,000 | Fidelity National Title | |
| Spencer Susan L | -- | First American Title Ins Co |
Source: Public Records
Mortgage History
| Date | Status | Borrower | Loan Amount |
|---|---|---|---|
| Closed | Pierson Gary | $142,350 | |
| Closed | Pierson Gary | $139,500 | |
| Previous Owner | Spencer Susan L | $97,500 |
Source: Public Records
Tax History Compared to Growth
Tax History
| Year | Tax Paid | Tax Assessment Tax Assessment Total Assessment is a certain percentage of the fair market value that is determined by local assessors to be the total taxable value of land and additions on the property. | Land | Improvement |
|---|---|---|---|---|
| 2024 | $5,929 | $492,000 | $123,000 | $369,000 |
| 2023 | $5,278 | $433,000 | $99,000 | $334,000 |
| 2022 | $4,872 | $453,000 | $107,000 | $346,000 |
| 2021 | $4,691 | $360,000 | $86,000 | $274,000 |
| 2020 | $4,286 | $328,000 | $80,000 | $248,000 |
| 2018 | $3,992 | $281,000 | $79,000 | $202,000 |
| 2017 | $3,875 | $249,000 | $72,000 | $177,000 |
| 2016 | $3,402 | $243,000 | $69,000 | $174,000 |
| 2015 | $3,182 | $226,000 | $64,000 | $162,000 |
| 2014 | -- | $204,000 | $61,000 | $143,000 |
| 2013 | -- | $156,000 | $56,000 | $100,000 |
Source: Public Records
Map
Nearby Homes