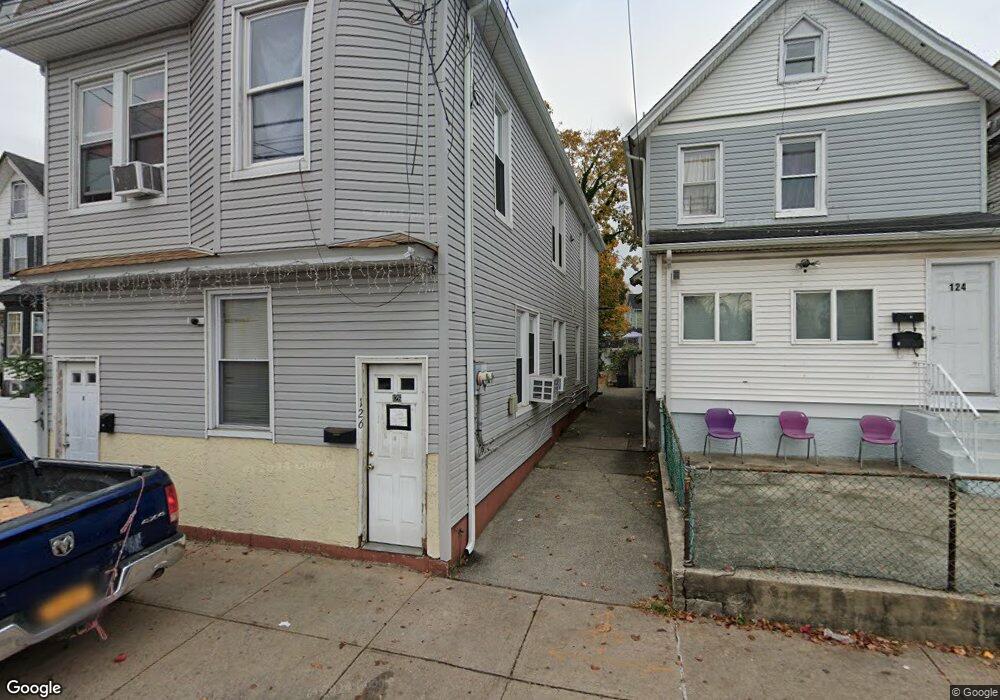
126 Jewett Ave Staten Island, NY 10302
Port Richmond NeighborhoodEstimated Value: $494,000 - $617,000
6
Beds
2
Baths
1,636
Sq Ft
$351/Sq Ft
Est. Value
About This Home
This home is located at 126 Jewett Ave, Staten Island, NY 10302 and is currently estimated at $574,446, approximately $351 per square foot. 126 Jewett Ave is a home located in Richmond County with nearby schools including P.S. 20 Port Richmond, I.S. 51 Edwin Markham, and Susan E Wagner High School.
Ownership History
Date
Name
Owned For
Owner Type
Purchase Details
Closed on
Aug 10, 2023
Sold by
Sawh Mohan and Sawh Annie
Bought by
126 Jewett Avenue Trust and Sawh
Current Estimated Value
Purchase Details
Closed on
Jan 23, 2002
Sold by
Sawh Mohan and Mohansingh Annie
Bought by
Sawh Mohan and Sawh Annie
Home Financials for this Owner
Home Financials are based on the most recent Mortgage that was taken out on this home.
Original Mortgage
$120,000
Interest Rate
6.85%
Mortgage Type
Purchase Money Mortgage
Purchase Details
Closed on
Dec 15, 1998
Sold by
Gupta Hira L
Bought by
Sawh Mohan and Mohansingh Annie
Home Financials for this Owner
Home Financials are based on the most recent Mortgage that was taken out on this home.
Original Mortgage
$75,600
Interest Rate
6.75%
Create a Home Valuation Report for This Property
The Home Valuation Report is an in-depth analysis detailing your home's value as well as a comparison with similar homes in the area
Home Values in the Area
Average Home Value in this Area
Purchase History
| Date | Buyer | Sale Price | Title Company |
|---|---|---|---|
| 126 Jewett Avenue Trust | -- | None Listed On Document | |
| Sawh Mohan | -- | First American Title Ins Co | |
| Sawh Mohan | $94,500 | Ticor Title Guarantee Compan |
Source: Public Records
Mortgage History
| Date | Status | Borrower | Loan Amount |
|---|---|---|---|
| Previous Owner | Sawh Mohan | $120,000 | |
| Previous Owner | Sawh Mohan | $75,600 |
Source: Public Records
Tax History Compared to Growth
Tax History
| Year | Tax Paid | Tax Assessment Tax Assessment Total Assessment is a certain percentage of the fair market value that is determined by local assessors to be the total taxable value of land and additions on the property. | Land | Improvement |
|---|---|---|---|---|
| 2025 | $4,095 | $34,680 | $3,316 | $31,364 |
| 2024 | $4,095 | $28,320 | $4,061 | $24,259 |
| 2023 | $4,110 | $20,236 | $3,623 | $16,613 |
| 2022 | $3,811 | $25,620 | $5,640 | $19,980 |
| 2021 | $3,790 | $24,420 | $5,640 | $18,780 |
| 2020 | $3,596 | $22,260 | $5,640 | $16,620 |
| 2019 | $3,554 | $22,500 | $5,640 | $16,860 |
| 2018 | $3,438 | $16,863 | $4,182 | $12,681 |
| 2017 | $3,243 | $15,909 | $4,778 | $11,131 |
| 2016 | $3,000 | $15,009 | $5,554 | $9,455 |
| 2015 | $2,717 | $14,160 | $4,680 | $9,480 |
| 2014 | $2,717 | $14,160 | $4,680 | $9,480 |
Source: Public Records
Map
Nearby Homes