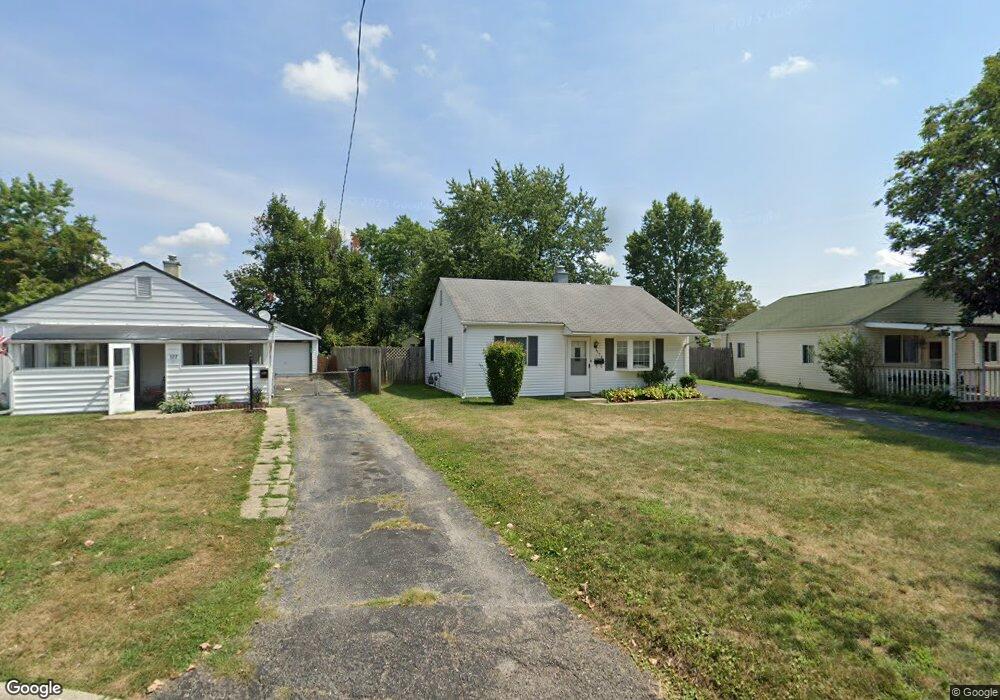
126 Little Flower Ln Columbus, OH 43213
Estimated Value: $128,000 - $179,220
2
Beds
1
Bath
942
Sq Ft
$176/Sq Ft
Est. Value
About This Home
This home is located at 126 Little Flower Ln, Columbus, OH 43213 and is currently estimated at $166,055, approximately $176 per square foot. 126 Little Flower Ln is a home located in Franklin County with nearby schools including Etna Road Elementary School, Beechwood Elementary School, and Rosemore Middle School.
Ownership History
Date
Name
Owned For
Owner Type
Purchase Details
Closed on
Oct 3, 2007
Sold by
The Huntington National Bank
Bought by
Hunter Cheryl A
Current Estimated Value
Purchase Details
Closed on
Jun 5, 2007
Sold by
Johnson Bobby Wayne and Case #06Cve10 13721
Bought by
The Huntington National Bank
Purchase Details
Closed on
Jan 7, 2005
Sold by
Johnson Bobby
Bought by
Johnson Bobby and Johnson Jackie L
Purchase Details
Closed on
Jul 7, 1998
Sold by
Johnson Bobby and Johnson Dorothy J
Bought by
Johnson Bobby and Johnson Dorothy J
Purchase Details
Closed on
May 8, 1992
Bought by
Johnson Bobby and Johnson Dorothy J
Purchase Details
Closed on
Feb 3, 1989
Create a Home Valuation Report for This Property
The Home Valuation Report is an in-depth analysis detailing your home's value as well as a comparison with similar homes in the area
Home Values in the Area
Average Home Value in this Area
Purchase History
| Date | Buyer | Sale Price | Title Company |
|---|---|---|---|
| Hunter Cheryl A | $59,100 | Hbi Title Services Inc | |
| The Huntington National Bank | $50,000 | None Available | |
| Johnson Bobby | -- | -- | |
| Johnson Bobby | -- | -- | |
| Johnson Bobby | $38,900 | -- | |
| -- | $50,000 | -- |
Source: Public Records
Tax History Compared to Growth
Tax History
| Year | Tax Paid | Tax Assessment Tax Assessment Total Assessment is a certain percentage of the fair market value that is determined by local assessors to be the total taxable value of land and additions on the property. | Land | Improvement |
|---|---|---|---|---|
| 2024 | $2,255 | $50,370 | $15,960 | $34,410 |
| 2023 | $2,239 | $50,365 | $15,960 | $34,405 |
| 2022 | $1,847 | $31,570 | $6,160 | $25,410 |
| 2021 | $1,737 | $31,570 | $6,160 | $25,410 |
| 2020 | $1,720 | $31,570 | $6,160 | $25,410 |
| 2019 | $1,631 | $26,010 | $4,900 | $21,110 |
| 2018 | $1,507 | $26,010 | $4,900 | $21,110 |
| 2017 | $1,578 | $26,010 | $4,900 | $21,110 |
| 2016 | $1,340 | $19,950 | $4,830 | $15,120 |
| 2015 | $1,352 | $19,950 | $4,830 | $15,120 |
| 2014 | $1,352 | $19,950 | $4,830 | $15,120 |
| 2013 | $714 | $22,155 | $5,355 | $16,800 |
Source: Public Records
Map
Nearby Homes
- 4489 Saint Margaret Ln
- 353 Shell Ct E
- 424 Cumberland Dr
- 322 Fairway Cir
- 451 Beaver Ave
- 469 Cumberland Dr
- 4368 Broadhurst Dr
- 571 S Hamilton Rd
- 4780 Etna Rd Unit 782
- 4232 Mayflower Blvd
- 547 Country Club Rd
- 4653 Kae Ave
- 579 Westphal Ave
- 110 Ironclad Dr Unit 9
- 4148 Elbern Ave
- 4662 Jae Ave
- 185 Prairiecreek Way Unit 185
- 686 Fairway Blvd
- 91 Robinwood Ave
- 798 S Yearling Rd
- 138 Little Flower Ln
- 122 Little Flower Ln
- 142 Little Flower Ln
- 118 Little Flower Ln
- 148 Little Flower Ln
- 123 Shumaker Ln
- 131 Shumaker Ln
- 137 Shumaker Ln
- 4680 Saint Francis Ln
- 152 Little Flower Ln
- 115 Shumaker Ln
- 143 S Hamilton Rd
- 137 Little Flower Ln
- 4672 St Francis Ln
- 4672 Saint Francis Ln
- 4657 Saint Francis Ln
- 160 Little Flower Ln
- 149 S Hamilton Rd
- 4664 Saint Francis Ln
- 147 Little Flower Ln