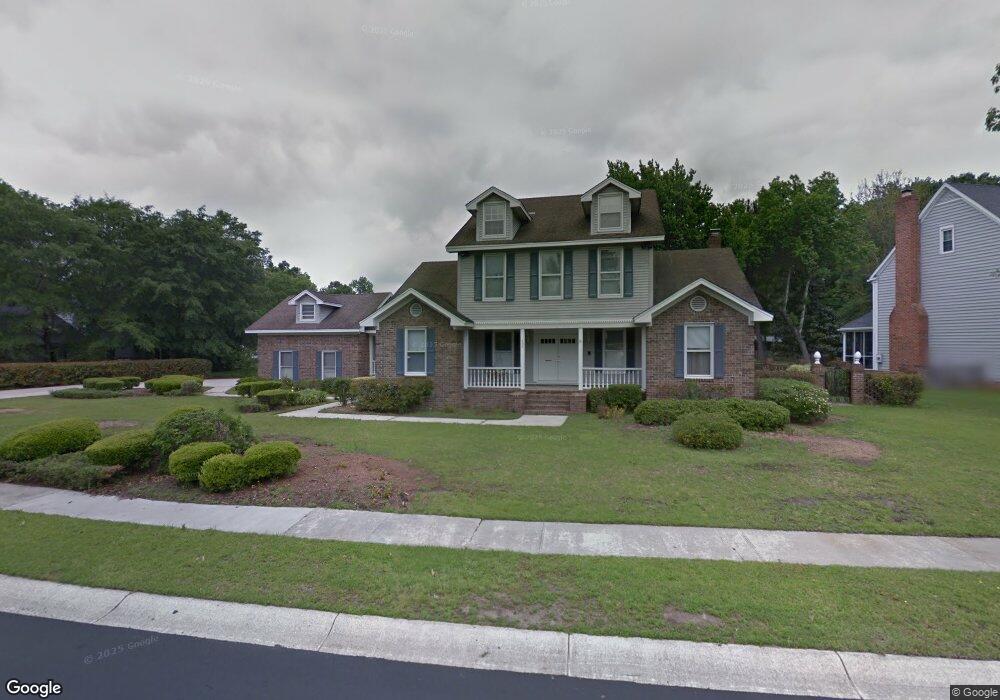
126 Londonderry Rd Goose Creek, SC 29445
Estimated Value: $506,000 - $550,000
5
Beds
4
Baths
2,882
Sq Ft
$182/Sq Ft
Est. Value
About This Home
This home is located at 126 Londonderry Rd, Goose Creek, SC 29445 and is currently estimated at $525,292, approximately $182 per square foot. 126 Londonderry Rd is a home located in Berkeley County with nearby schools including Westview Primary School, Westview Elementary School, and Westview Middle School.
Ownership History
Date
Name
Owned For
Owner Type
Purchase Details
Closed on
Sep 2, 2014
Sold by
Haynes James E and Haynes Albert
Bought by
Haynes Albert
Current Estimated Value
Home Financials for this Owner
Home Financials are based on the most recent Mortgage that was taken out on this home.
Original Mortgage
$291,000
Outstanding Balance
$223,026
Interest Rate
4.17%
Mortgage Type
Future Advance Clause Open End Mortgage
Estimated Equity
$302,266
Purchase Details
Closed on
Dec 6, 2011
Sold by
Haynes James E
Bought by
Haynes James E and Haynes Albert
Purchase Details
Closed on
Sep 8, 2011
Sold by
Regions Bank
Bought by
Haynes James E
Purchase Details
Closed on
Apr 12, 2011
Sold by
Smith Richard H and Smith Chantal N
Bought by
Regions Bank
Purchase Details
Closed on
May 17, 2001
Sold by
Brumbelow Kathleen F
Bought by
Smith Richard H and Smith Audrey M
Create a Home Valuation Report for This Property
The Home Valuation Report is an in-depth analysis detailing your home's value as well as a comparison with similar homes in the area
Home Values in the Area
Average Home Value in this Area
Purchase History
| Date | Buyer | Sale Price | Title Company |
|---|---|---|---|
| Haynes Albert | -- | -- | |
| Haynes James E | -- | -- | |
| Haynes James E | $235,000 | -- | |
| Regions Bank | $500 | -- | |
| Smith Richard H | $262,000 | -- |
Source: Public Records
Mortgage History
| Date | Status | Borrower | Loan Amount |
|---|---|---|---|
| Open | Haynes Albert | $291,000 |
Source: Public Records
Tax History Compared to Growth
Tax History
| Year | Tax Paid | Tax Assessment Tax Assessment Total Assessment is a certain percentage of the fair market value that is determined by local assessors to be the total taxable value of land and additions on the property. | Land | Improvement |
|---|---|---|---|---|
| 2025 | $320 | $329,878 | $47,279 | $282,599 |
| 2024 | $296 | $13,195 | $1,891 | $11,304 |
| 2023 | $296 | $13,195 | $1,891 | $11,304 |
| 2022 | $276 | $11,474 | $1,695 | $9,779 |
| 2021 | $276 | $11,480 | $1,695 | $9,779 |
| 2020 | $276 | $11,474 | $1,695 | $9,779 |
| 2019 | $246 | $11,474 | $1,695 | $9,779 |
| 2018 | $246 | $9,978 | $1,414 | $8,564 |
| 2017 | $246 | $9,978 | $1,414 | $8,564 |
| 2016 | $246 | $9,970 | $1,410 | $8,560 |
| 2015 | $246 | $9,970 | $1,410 | $8,560 |
| 2014 | $1,240 | $9,970 | $1,410 | $8,560 |
| 2013 | -- | $9,970 | $1,410 | $8,560 |
Source: Public Records
Map
Nearby Homes
- 111 Prentice Cir
- 119 Stratford Dr
- 108 Dresden Dr
- 109 Edgewood Ln
- 105 Shelton Ln
- 112 Edgewood Ln
- 58 Indigo Ln
- 102 Brush Blvd
- 201 Commons Way
- 112 Chownings Ln
- 111 Bassett Ct
- 18 Rudwick Cir Unit 18
- 11 Hunters Ct
- 203 Blenheim Ct
- 105 Barrington Blvd
- 109 Aldrich Place
- 128 Foxborough Rd
- 122 Hidden Fawn Cir
- 135 Commons Way
- 115 Waddington Trace
- 102 Dominion Cir
- 120 Londonderry Rd
- 130 Londonderry Rd
- 104 Dominion Cir
- 127 Londonderry Rd
- 129 Londonderry Rd
- 125 Londonderry Rd
- 0 Dominion Cir
- 118 Londonderry Rd
- 106 Dominion Cir
- 123 Londonderry Rd
- 133 Londonderry Rd
- 105 Dominion Cir
- 103 Dominion Cir
- 132 Londonderry Rd
- 121 Londonderry Rd
- 108 Dominion Cir
- 112 Londonderry Rd
- 112 Londonderry Rd Unit 2357241-47527
- 107 Dominion Cir