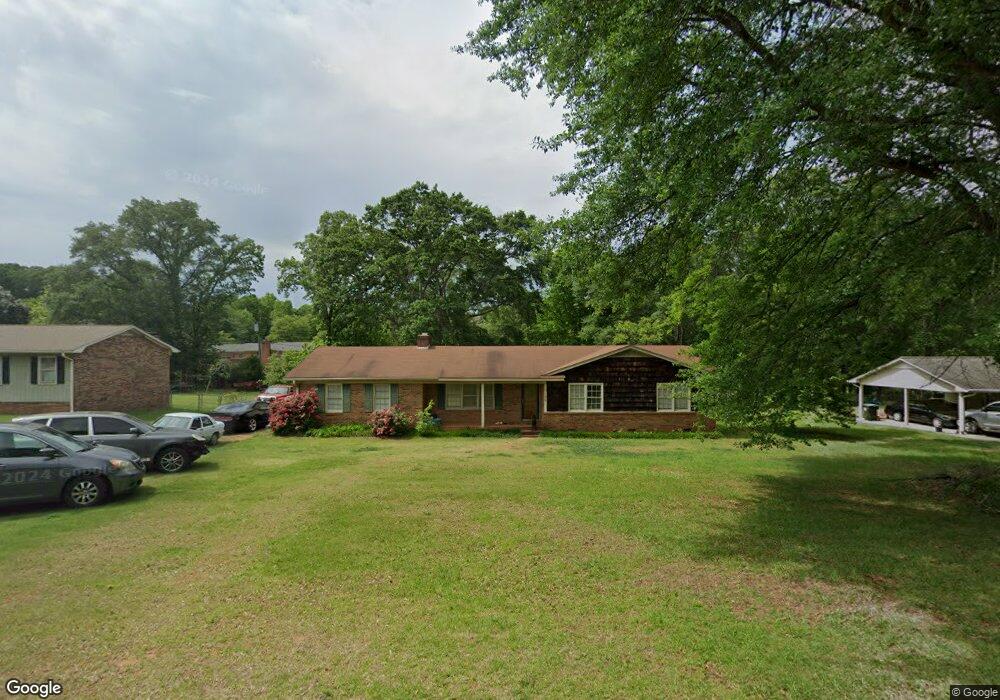
126 Mabry Rd Spartanburg, SC 29307
Estimated Value: $205,000 - $221,405
3
Beds
2
Baths
1,418
Sq Ft
$152/Sq Ft
Est. Value
About This Home
This home is located at 126 Mabry Rd, Spartanburg, SC 29307 and is currently estimated at $215,351, approximately $151 per square foot. 126 Mabry Rd is a home located in Spartanburg County with nearby schools including Broome High School and Spartanburg Day School.
Ownership History
Date
Name
Owned For
Owner Type
Purchase Details
Closed on
Jul 29, 2016
Sold by
Secretary Of Housing And Urban Developme
Bought by
Taylor Jeffery Scott
Current Estimated Value
Purchase Details
Closed on
Mar 14, 2016
Sold by
Wells Fargo Bank Na
Bought by
Secretary Of Hud
Purchase Details
Closed on
Mar 6, 2012
Sold by
Us Bank National Associaiton
Bought by
Harvey Perry
Home Financials for this Owner
Home Financials are based on the most recent Mortgage that was taken out on this home.
Original Mortgage
$73,585
Interest Rate
4.01%
Mortgage Type
FHA
Purchase Details
Closed on
Nov 21, 2011
Sold by
Greene Richard W
Bought by
Us Bank National Association
Purchase Details
Closed on
Jun 26, 2002
Sold by
Gardner Rodney W and Gardner Lesa K
Bought by
Greene Richard W
Purchase Details
Closed on
May 14, 2002
Sold by
Gardner Rodney W and Gardner Lesa K
Bought by
Fleming Charles E and Fleming Janine W
Create a Home Valuation Report for This Property
The Home Valuation Report is an in-depth analysis detailing your home's value as well as a comparison with similar homes in the area
Home Values in the Area
Average Home Value in this Area
Purchase History
| Date | Buyer | Sale Price | Title Company |
|---|---|---|---|
| Taylor Jeffery Scott | $65,618 | None Available | |
| Secretary Of Hud | -- | None Available | |
| Harvey Perry | $75,500 | -- | |
| Us Bank National Association | $2,500 | -- | |
| Greene Richard W | $115,000 | -- | |
| Fleming Charles E | -- | -- |
Source: Public Records
Mortgage History
| Date | Status | Borrower | Loan Amount |
|---|---|---|---|
| Previous Owner | Harvey Perry | $73,585 |
Source: Public Records
Tax History Compared to Growth
Tax History
| Year | Tax Paid | Tax Assessment Tax Assessment Total Assessment is a certain percentage of the fair market value that is determined by local assessors to be the total taxable value of land and additions on the property. | Land | Improvement |
|---|---|---|---|---|
| 2025 | $672 | $5,469 | $730 | $4,739 |
| 2024 | $672 | $5,469 | $730 | $4,739 |
| 2023 | $672 | $5,469 | $730 | $4,739 |
| 2022 | $555 | $4,756 | $600 | $4,156 |
| 2021 | $555 | $4,756 | $600 | $4,156 |
| 2020 | $542 | $4,756 | $600 | $4,156 |
| 2019 | $619 | $4,756 | $600 | $4,156 |
| 2018 | $512 | $4,756 | $600 | $4,156 |
| 2017 | $399 | $4,244 | $600 | $3,644 |
| 2016 | $3,431 | $8,058 | $900 | $7,158 |
| 2015 | $872 | $5,372 | $600 | $4,772 |
| 2014 | $867 | $5,372 | $600 | $4,772 |
Source: Public Records
Map
Nearby Homes
- 1926 Bud Arthur Bridge Rd
- 215 Penny Bennett Rd
- 204 Bennett Dairy Rd
- 124 Childress Rd
- 230 Idlewood Cir
- 112 Riverview Park
- 655 Idlewood Cir
- 000 Burns Rd Unit LOT 1
- 000 Burns Rd
- 000 Burns Rd Unit LOT 2
- 49 Thurgood Marshall Rd
- 3091 E Main Street Extension
- 0 Old Converse Rd
- Lot 31 State Road S-42-2288
- 3025 E Main Street Extension
- 250 Leeds Ln
- 270 Leeds Ln
- 276 Saranac Dr
- 9015 Margot Place
- 389 Main St
- 122 Mabry Rd
- 130 Mabry Rd
- 150 Sprouse Rd
- 101 Dean Ct
- 146 Sprouse Rd
- 134 Mabry Rd
- 697 Tacoma Trail
- 693 Tacoma Trail
- 689 Tacoma Trail
- 717 Tacoma Trail
- 721 Tacoma Trail
- 725 Tacoma Trail
- 705 Tacoma Trail
- 682 Tacoma Trail
- 674 Tacoma Trail
- 669 Tacoma Trail
- 665 Tacoma Trail
- 661 Tacoma Trail
- 102 Dean Ct
- 118 Mabry Rd