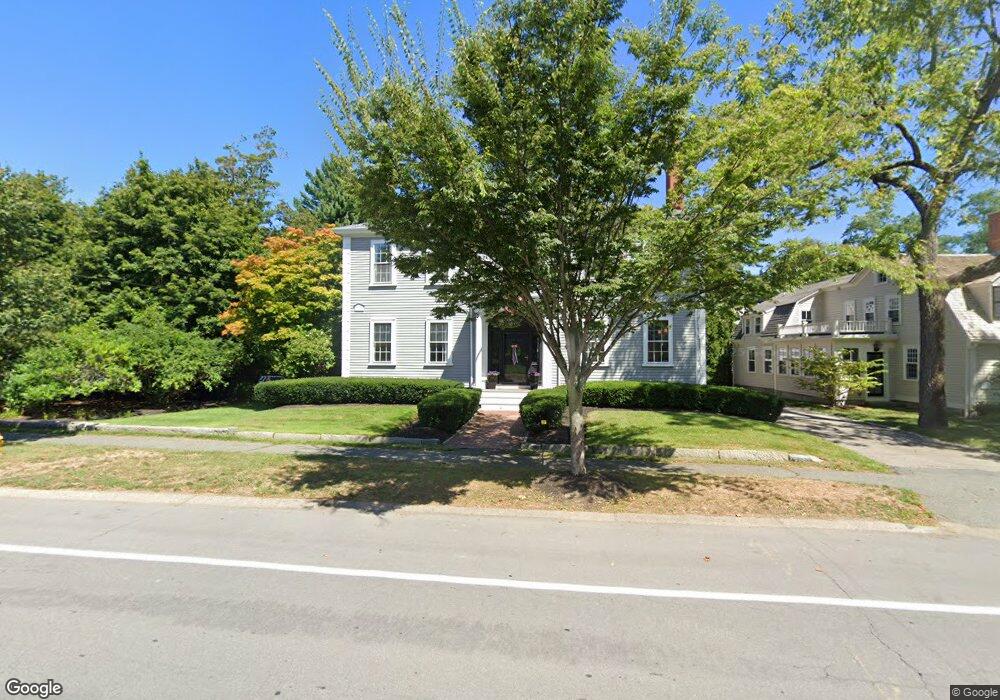
126 Main St Hingham, MA 02043
Estimated Value: $3,102,240 - $3,502,000
5
Beds
6
Baths
5,296
Sq Ft
$619/Sq Ft
Est. Value
About This Home
This home is located at 126 Main St, Hingham, MA 02043 and is currently estimated at $3,276,060, approximately $618 per square foot. 126 Main St is a home located in Plymouth County with nearby schools including East Elementary School, Hingham Middle School, and Hingham High School.
Ownership History
Date
Name
Owned For
Owner Type
Purchase Details
Closed on
Apr 8, 2021
Sold by
Srr Ret
Bought by
Abbott Matthew T and Abbott Sara A
Current Estimated Value
Home Financials for this Owner
Home Financials are based on the most recent Mortgage that was taken out on this home.
Original Mortgage
$1,915,000
Outstanding Balance
$1,721,985
Interest Rate
2.75%
Mortgage Type
Purchase Money Mortgage
Estimated Equity
$1,554,075
Purchase Details
Closed on
May 20, 2008
Sold by
Roy-Reposa Susan
Bought by
Srr Ret
Purchase Details
Closed on
Apr 23, 2003
Sold by
Srr Ret
Bought by
Roy Susan
Home Financials for this Owner
Home Financials are based on the most recent Mortgage that was taken out on this home.
Original Mortgage
$243,217
Interest Rate
5.64%
Mortgage Type
Purchase Money Mortgage
Purchase Details
Closed on
Mar 25, 1998
Sold by
Roy Susan
Bought by
Srr Ret
Purchase Details
Closed on
Mar 23, 1993
Sold by
Darlis Robert G and Darlis Virginia R
Bought by
Roy Susan
Home Financials for this Owner
Home Financials are based on the most recent Mortgage that was taken out on this home.
Original Mortgage
$434,000
Interest Rate
7.75%
Mortgage Type
Purchase Money Mortgage
Purchase Details
Closed on
Apr 29, 1987
Sold by
Congdon Robbin L
Bought by
Karlis Robert G
Purchase Details
Closed on
Jan 5, 1987
Sold by
Stallard Elbert S
Bought by
Stallard Robert A
Create a Home Valuation Report for This Property
The Home Valuation Report is an in-depth analysis detailing your home's value as well as a comparison with similar homes in the area
Purchase History
| Date | Buyer | Sale Price | Title Company |
|---|---|---|---|
| Abbott Matthew T | $2,395,000 | None Available | |
| Srr Ret | -- | -- | |
| Roy Susan | -- | -- | |
| Srr Ret | $612,500 | -- | |
| Roy Susan | $620,000 | -- | |
| Karlis Robert G | $564,000 | -- | |
| Stallard Robert A | $500,000 | -- |
Source: Public Records
Mortgage History
| Date | Status | Borrower | Loan Amount |
|---|---|---|---|
| Open | Abbott Matthew T | $1,915,000 | |
| Previous Owner | Stallard Robert A | $243,217 | |
| Previous Owner | Stallard Robert A | $436,000 | |
| Previous Owner | Stallard Robert A | $434,000 |
Source: Public Records
Tax History
| Year | Tax Paid | Tax Assessment Tax Assessment Total Assessment is a certain percentage of the fair market value that is determined by local assessors to be the total taxable value of land and additions on the property. | Land | Improvement |
|---|---|---|---|---|
| 2025 | $26,813 | $2,508,200 | $881,600 | $1,626,600 |
| 2024 | $26,836 | $2,473,400 | $881,600 | $1,591,800 |
| 2023 | $24,248 | $2,424,800 | $881,600 | $1,543,200 |
| 2022 | $24,892 | $2,153,300 | $800,000 | $1,353,300 |
| 2021 | $24,264 | $2,056,300 | $755,400 | $1,300,900 |
| 2020 | $20,723 | $1,797,300 | $755,400 | $1,041,900 |
| 2019 | $10,023 | $1,778,700 | $755,400 | $1,023,300 |
| 2018 | $20,570 | $1,747,700 | $755,400 | $992,300 |
| 2017 | $19,783 | $1,614,900 | $799,200 | $815,700 |
| 2016 | $19,693 | $1,576,700 | $761,000 | $815,700 |
| 2015 | $19,044 | $1,519,900 | $704,200 | $815,700 |
Source: Public Records
Map
Nearby Homes
Your Personal Tour Guide
Ask me questions while you tour the home.