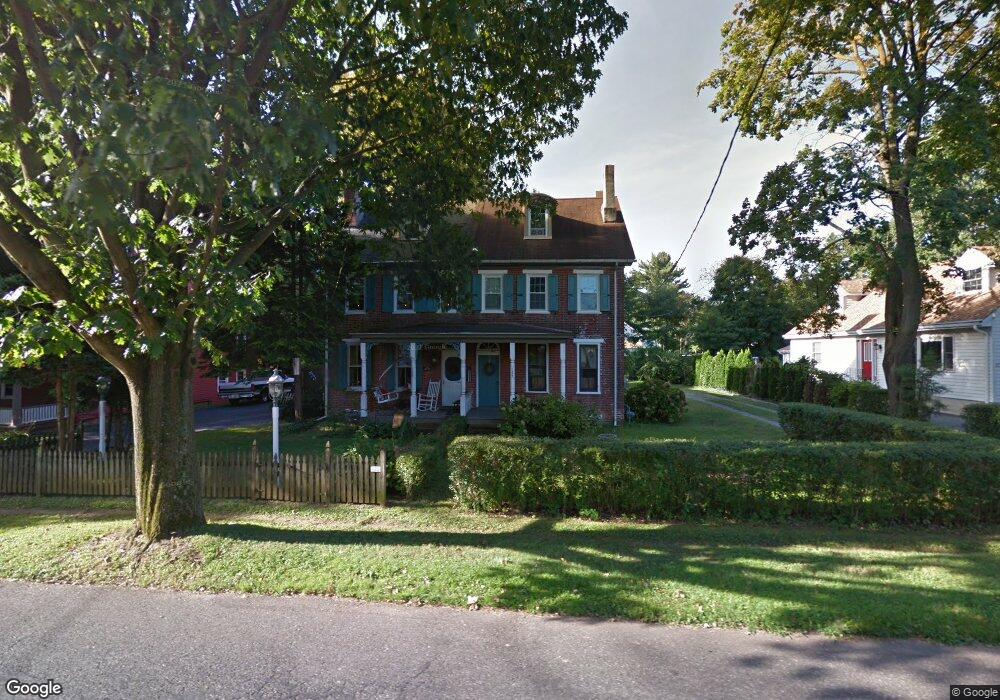
126 Main St Rancocas, NJ 08073
Estimated Value: $427,008 - $444,000
--
Bed
--
Bath
2,638
Sq Ft
$165/Sq Ft
Est. Value
About This Home
This home is located at 126 Main St, Rancocas, NJ 08073 and is currently estimated at $434,752, approximately $164 per square foot. 126 Main St is a home located in Burlington County with nearby schools including Holly Hills Elementary School, Westampton Intermediate School, and Rancocas Valley Regional High School.
Ownership History
Date
Name
Owned For
Owner Type
Purchase Details
Closed on
Sep 30, 2004
Sold by
Faix Isabel A and Faix Glenn R
Bought by
Bucci Anthony J and Bucci Constance
Current Estimated Value
Home Financials for this Owner
Home Financials are based on the most recent Mortgage that was taken out on this home.
Original Mortgage
$177,520
Outstanding Balance
$84,838
Interest Rate
5.25%
Mortgage Type
New Conventional
Estimated Equity
$349,914
Purchase Details
Closed on
Mar 8, 2000
Sold by
Michalski Christopher
Bought by
Michalski Isabel A
Purchase Details
Closed on
Apr 25, 1996
Sold by
Houser Orin G and Houser Valerie S
Bought by
Michalski Christopher and Michalski Isabel A
Create a Home Valuation Report for This Property
The Home Valuation Report is an in-depth analysis detailing your home's value as well as a comparison with similar homes in the area
Home Values in the Area
Average Home Value in this Area
Purchase History
| Date | Buyer | Sale Price | Title Company |
|---|---|---|---|
| Bucci Anthony J | $221,900 | Regional Title Agency | |
| Michalski Isabel A | -- | -- | |
| Michalski Christopher | $80,000 | -- |
Source: Public Records
Mortgage History
| Date | Status | Borrower | Loan Amount |
|---|---|---|---|
| Open | Bucci Anthony J | $177,520 |
Source: Public Records
Tax History Compared to Growth
Tax History
| Year | Tax Paid | Tax Assessment Tax Assessment Total Assessment is a certain percentage of the fair market value that is determined by local assessors to be the total taxable value of land and additions on the property. | Land | Improvement |
|---|---|---|---|---|
| 2025 | $6,469 | $230,300 | $73,000 | $157,300 |
| 2024 | $6,225 | $230,300 | $73,000 | $157,300 |
| 2023 | $6,225 | $230,300 | $73,000 | $157,300 |
| 2022 | $5,914 | $230,300 | $73,000 | $157,300 |
| 2021 | $4,277 | $230,300 | $73,000 | $157,300 |
| 2020 | $5,672 | $230,300 | $73,000 | $157,300 |
| 2019 | $5,557 | $230,300 | $73,000 | $157,300 |
| 2018 | $5,486 | $230,300 | $73,000 | $157,300 |
| 2017 | $5,341 | $230,300 | $73,000 | $157,300 |
| 2016 | $5,242 | $230,300 | $73,000 | $157,300 |
| 2015 | $5,140 | $230,300 | $73,000 | $157,300 |
| 2014 | $5,009 | $230,300 | $73,000 | $157,300 |
Source: Public Records
Map
Nearby Homes