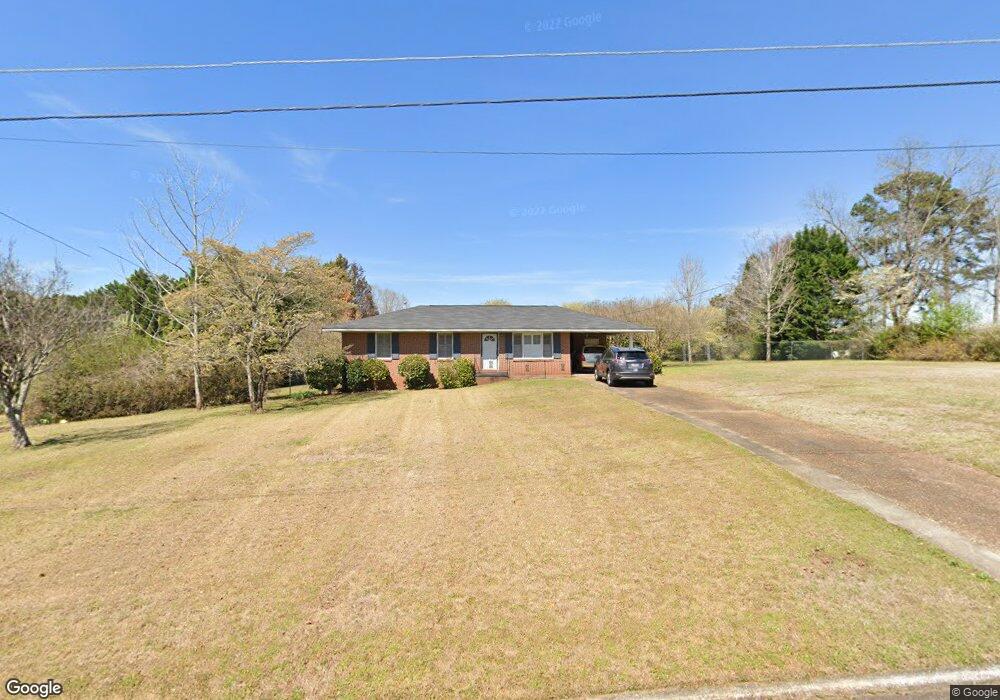
126 N Chilton Crescent Lagrange, GA 30240
Estimated Value: $181,000 - $205,000
3
Beds
2
Baths
1,179
Sq Ft
$161/Sq Ft
Est. Value
About This Home
This home is located at 126 N Chilton Crescent, Lagrange, GA 30240 and is currently estimated at $190,078, approximately $161 per square foot. 126 N Chilton Crescent is a home located in Troup County with nearby schools including Franklin Forest Elementary School, Hollis Hand Elementary School, and Ethel W. Kight Elementary School.
Ownership History
Date
Name
Owned For
Owner Type
Purchase Details
Closed on
Apr 25, 2000
Sold by
Jimmy Oliver Morris
Bought by
Morris James Oliver
Current Estimated Value
Purchase Details
Closed on
Apr 24, 2000
Sold by
James Oliver Morris Etal
Bought by
Jimmy Oliver Morris
Purchase Details
Closed on
May 6, 1996
Sold by
James Oliver Morris
Bought by
James Oliver Morris Etal
Purchase Details
Closed on
Jun 16, 1995
Bought by
James Oliver Morris
Purchase Details
Closed on
Mar 1, 1960
Sold by
Jenkins Donald R and Jenkins Matthews J
Create a Home Valuation Report for This Property
The Home Valuation Report is an in-depth analysis detailing your home's value as well as a comparison with similar homes in the area
Home Values in the Area
Average Home Value in this Area
Purchase History
| Date | Buyer | Sale Price | Title Company |
|---|---|---|---|
| Morris James Oliver | -- | -- | |
| Jimmy Oliver Morris | -- | -- | |
| James Oliver Morris Etal | -- | -- | |
| James Oliver Morris | -- | -- | |
| -- | -- | -- |
Source: Public Records
Tax History Compared to Growth
Tax History
| Year | Tax Paid | Tax Assessment Tax Assessment Total Assessment is a certain percentage of the fair market value that is determined by local assessors to be the total taxable value of land and additions on the property. | Land | Improvement |
|---|---|---|---|---|
| 2024 | $1,548 | $56,760 | $13,200 | $43,560 |
| 2023 | $1,333 | $48,880 | $13,200 | $35,680 |
| 2022 | $1,262 | $45,200 | $13,200 | $32,000 |
| 2021 | $340 | $40,000 | $13,200 | $26,800 |
| 2020 | $906 | $40,000 | $13,200 | $26,800 |
| 2019 | $867 | $38,720 | $13,200 | $25,520 |
| 2018 | $867 | $38,720 | $13,200 | $25,520 |
| 2017 | $649 | $31,490 | $9,450 | $22,040 |
| 2016 | $631 | $30,883 | $9,450 | $21,433 |
| 2015 | $646 | $31,337 | $9,904 | $21,433 |
| 2014 | $611 | $30,208 | $9,904 | $20,305 |
| 2013 | -- | $30,927 | $9,924 | $21,003 |
Source: Public Records
Map
Nearby Homes
- 201 S Chilton Crescent
- 203 S Chilton Crescent
- 106 S Chilton Crescent
- 100 Creekside Dr Unit LOT 60A
- 107 Dixie Creek Dr
- 724 Camellia Dr
- 106 Ewing St
- 102 Ewing St
- 145 Turner St
- 748 Lakewood Dr
- 204 Colonial St
- 110 Russell St
- 806 New Franklin Rd
- 114 Briarcliff Rd
- 900 North St
- 127 Ashling Dr
- 134 S Page St
- 109 Thomas St
- 89 Chase Rd
- 219 Banks St
- N N Chilton Crescent Unit 4
- N N Chilton Crescent
- 122 N Chilton Crescent
- 148 Wisteria Ridge Terrace
- 146 Wisteria Ridge Terrace
- 132 N Chilton Crescent
- 150 Wisteria Ridge Terrace Unit 26
- 150 Wisteria Ridge Terrace
- 150 Wisteria Unit 26
- 144 Wisteria Ridge Terrace
- 144 Wisteria Ridge Terrace Unit 23
- 152 Wisteria Ridge Terrace
- 125 N Chilton Crescent
- 120 N Chilton Crescent
- 142 Wisteria Ridge Terrace
- 216 N Chilton Crescent
- 123 N Chilton Crescent
- 154 Wisteria Ridge Terrace
- 127 N Chilton Crescent
- 121 N Chilton Crescent