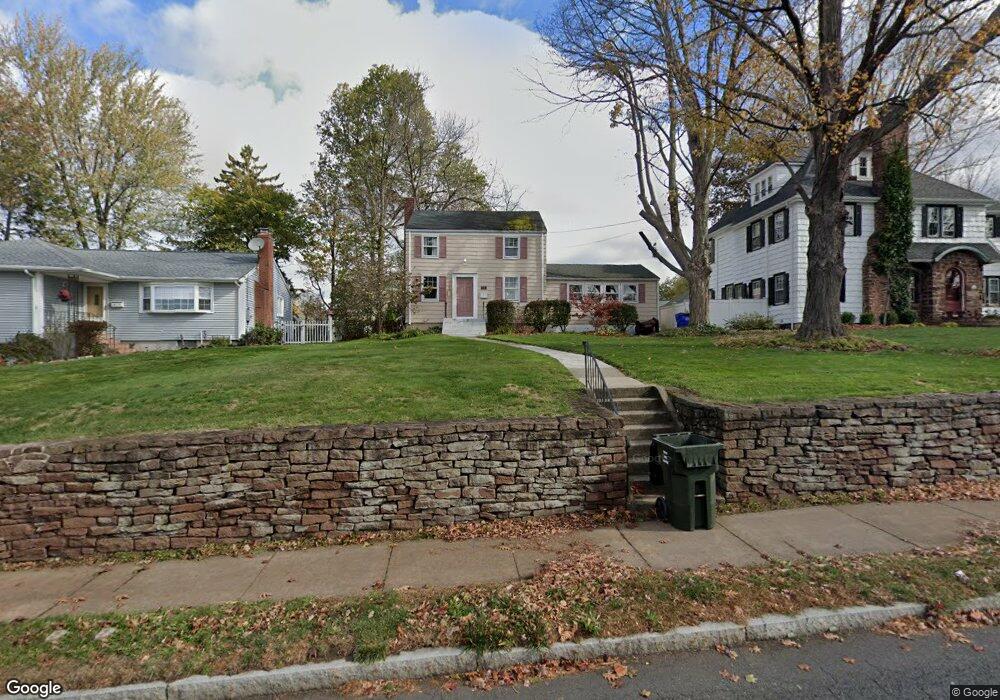
126 N Main St West Hartford, CT 06107
Estimated Value: $417,504 - $497,000
2
Beds
2
Baths
1,412
Sq Ft
$316/Sq Ft
Est. Value
About This Home
This home is located at 126 N Main St, West Hartford, CT 06107 and is currently estimated at $446,126, approximately $315 per square foot. 126 N Main St is a home located in Hartford County with nearby schools including Bugbee School, King Philip Middle School, and Hall High School.
Ownership History
Date
Name
Owned For
Owner Type
Purchase Details
Closed on
Mar 22, 1993
Sold by
Bixby G Andrew and Bixby Carolyn
Bought by
Cusanno Buy and Cusanno Sheryl
Current Estimated Value
Home Financials for this Owner
Home Financials are based on the most recent Mortgage that was taken out on this home.
Original Mortgage
$102,000
Interest Rate
7.75%
Mortgage Type
Unknown
Create a Home Valuation Report for This Property
The Home Valuation Report is an in-depth analysis detailing your home's value as well as a comparison with similar homes in the area
Home Values in the Area
Average Home Value in this Area
Purchase History
| Date | Buyer | Sale Price | Title Company |
|---|---|---|---|
| Cusanno Buy | $131,500 | -- |
Source: Public Records
Mortgage History
| Date | Status | Borrower | Loan Amount |
|---|---|---|---|
| Closed | Cusanno Buy | $232,500 | |
| Closed | Cusanno Buy | $146,000 | |
| Closed | Cusanno Buy | $102,000 | |
| Previous Owner | Cusanno Buy | $135,000 |
Source: Public Records
Tax History Compared to Growth
Tax History
| Year | Tax Paid | Tax Assessment Tax Assessment Total Assessment is a certain percentage of the fair market value that is determined by local assessors to be the total taxable value of land and additions on the property. | Land | Improvement |
|---|---|---|---|---|
| 2025 | $7,982 | $178,250 | $73,600 | $104,650 |
| 2024 | $7,549 | $178,250 | $73,600 | $104,650 |
| 2023 | $7,294 | $178,250 | $73,600 | $104,650 |
| 2022 | $7,251 | $178,250 | $73,600 | $104,650 |
| 2021 | $7,248 | $170,870 | $87,400 | $83,470 |
| 2020 | $7,142 | $170,870 | $84,900 | $85,970 |
| 2019 | $7,142 | $170,870 | $84,910 | $85,960 |
| 2018 | $7,006 | $170,870 | $84,910 | $85,960 |
| 2017 | $7,013 | $170,870 | $84,910 | $85,960 |
| 2016 | $6,837 | $173,040 | $79,450 | $93,590 |
| 2015 | $6,629 | $173,040 | $79,450 | $93,590 |
| 2014 | $6,467 | $173,040 | $79,450 | $93,590 |
Source: Public Records
Map
Nearby Homes
- 101 N Main St
- 473 Fern St
- 89 N Main St
- 183 Loomis Dr Unit 104
- 1110 Trout Brook Dr
- 37 Sylvan Ave
- 42 N Main St Unit 78
- 95 Clifton Ave
- 97 Robin Rd
- 356 Fern St
- 1268 Trout Brook Dr
- 1272 Trout Brook Dr
- 129 Middlebrook Rd
- 54 Robin Rd Unit B2
- 31 Robin Rd Unit 102
- 209 Ballard Dr
- 26 Robin Rd Unit 3
- 51 Bretton Rd
- 18 Robin Rd Unit 1
- 889 Farmington Ave Unit 4E