Estimated Value: $728,767 - $834,000
5
Beds
4
Baths
4,100
Sq Ft
$194/Sq Ft
Est. Value
About This Home
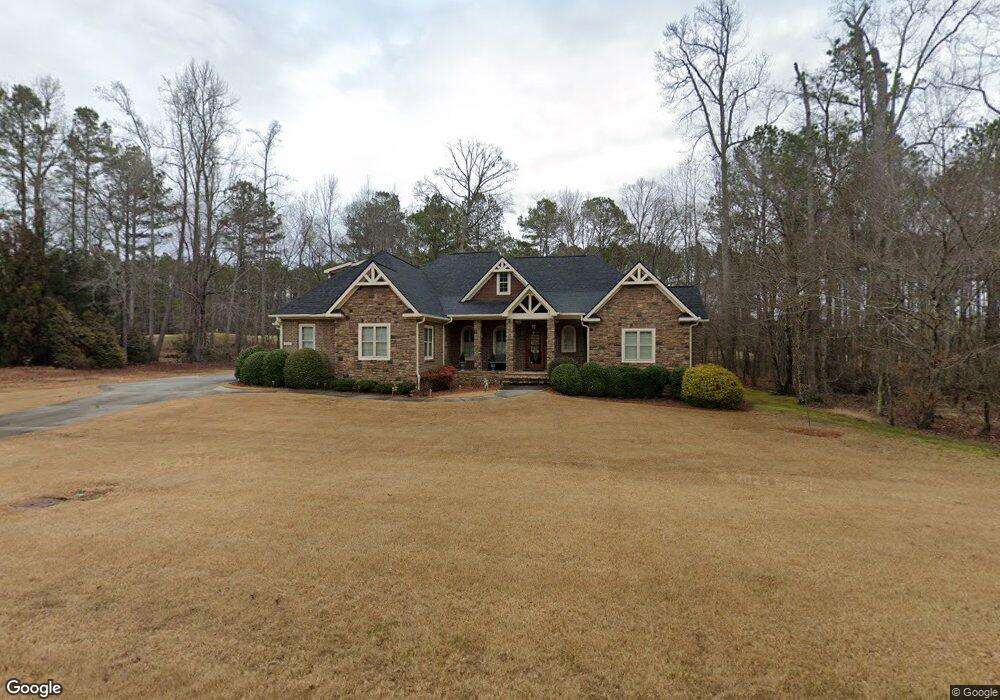
This home is located at 126 Nelson Blvd NW, Rome, GA 30165 and is currently estimated at $797,442, approximately $194 per square foot. 126 Nelson Blvd NW is a home located in Floyd County with nearby schools including Rome High School.
Ownership History
Date
Name
Owned For
Owner Type
Purchase Details
Closed on
Sep 4, 2020
Sold by
Bays Cathryn N
Bought by
Macleod David Scott and Macleod Margaret
Current Estimated Value
Purchase Details
Closed on
Aug 15, 2011
Sold by
Bays Leland R
Bought by
Bays Leland R
Home Financials for this Owner
Home Financials are based on the most recent Mortgage that was taken out on this home.
Original Mortgage
$272,200
Interest Rate
3.5%
Mortgage Type
New Conventional
Purchase Details
Closed on
Jul 12, 2010
Bought by
P and R
Purchase Details
Closed on
Jul 30, 2009
Sold by
Smith Brandon
Bought by
Bays Leland R
Home Financials for this Owner
Home Financials are based on the most recent Mortgage that was taken out on this home.
Original Mortgage
$564,000
Interest Rate
5.26%
Mortgage Type
Reverse Mortgage Home Equity Conversion Mortgage
Purchase Details
Closed on
Jun 19, 2008
Sold by
Not Provided
Bought by
Bays Leland R
Purchase Details
Closed on
Oct 31, 2005
Sold by
Ctr Development Co Llc
Bought by
Spring Creek Holdings Llc
Purchase Details
Closed on
Sep 28, 2000
Bought by
Ctr Development Co Llc
Create a Home Valuation Report for This Property
The Home Valuation Report is an in-depth analysis detailing your home's value as well as a comparison with similar homes in the area
Home Values in the Area
Average Home Value in this Area
Purchase History
| Date | Buyer | Sale Price | Title Company |
|---|---|---|---|
| Macleod David Scott | $537,000 | -- | |
| Bays Leland R | -- | -- | |
| P | -- | -- | |
| Bays Leland R | $376,000 | -- | |
| Bays Leland R | $432,000 | -- | |
| Spring Creek Holdings Llc | $45,800 | -- | |
| Ctr Development Co Llc | -- | -- |
Source: Public Records
Mortgage History
| Date | Status | Borrower | Loan Amount |
|---|---|---|---|
| Previous Owner | Bays Leland R | $272,200 | |
| Previous Owner | Bays Leland R | $564,000 |
Source: Public Records
Tax History Compared to Growth
Tax History
| Year | Tax Paid | Tax Assessment Tax Assessment Total Assessment is a certain percentage of the fair market value that is determined by local assessors to be the total taxable value of land and additions on the property. | Land | Improvement |
|---|---|---|---|---|
| 2024 | $7,778 | $284,884 | $18,060 | $266,824 |
| 2023 | $7,713 | $279,269 | $18,060 | $261,209 |
| 2022 | $7,158 | $239,118 | $17,200 | $221,918 |
| 2021 | $6,525 | $195,958 | $17,200 | $178,758 |
| 2020 | $3,470 | $184,523 | $17,200 | $167,323 |
| 2019 | $3,381 | $176,991 | $17,200 | $159,791 |
| 2018 | $3,262 | $169,205 | $17,200 | $152,005 |
| 2017 | $3,252 | $165,147 | $17,200 | $147,947 |
| 2016 | $3,306 | $162,800 | $17,200 | $145,600 |
| 2015 | $3,352 | $160,536 | $17,200 | $143,336 |
| 2014 | $3,352 | $160,536 | $17,200 | $143,336 |
Source: Public Records
Map
Nearby Homes
- 6 Irwin Ct NW
- 142 Nelson Blvd NW
- 8 Irwin Ct NW
- 14 Snead Ave NW
- 16 Nelson Blvd NW
- 20 Trotters Ln NW
- 25 Trotters Ln NW
- 8 Hitchin Post Dr NW
- 30 Silverbell Ln NW
- 8 Walking Horse Dr NW
- 7 Hogan Ln NW
- 13 & 15 Crabapple Ln NW
- 13&15 Crabapple Ln
- 12 Silverbell Ln
- 10 Silverbell Ln
- 4 Silverbell Ln
- 8 Silverbell Ln
- 124 Nelson Blvd NW
- 128 Nelson Blvd NW Unit 27
- 128 Nelson Blvd NW
- 125 Nelson Blvd NW
- 127 Nelson Blvd NW
- 130 Nelson Blvd NW
- 122 Nelson Blvd NW
- 122 Nelson Blvd NW Unit 24
- 123 Nelson Blvd NW Unit 86
- 123 Nelson Blvd NW
- 129 Nelson Blvd NW
- 121 Nelson Blvd NW
- 121 Nelson Blvd NW Unit 85
- 120 Nelson Blvd NW
- 131 Nelson Blvd NW
- 119 Nelson Blvd NW
- 134 Nelson Blvd NW
- 118 Nelson Blvd NW
- 133 Nelson Blvd NW
- 117 Nelson Blvd NW