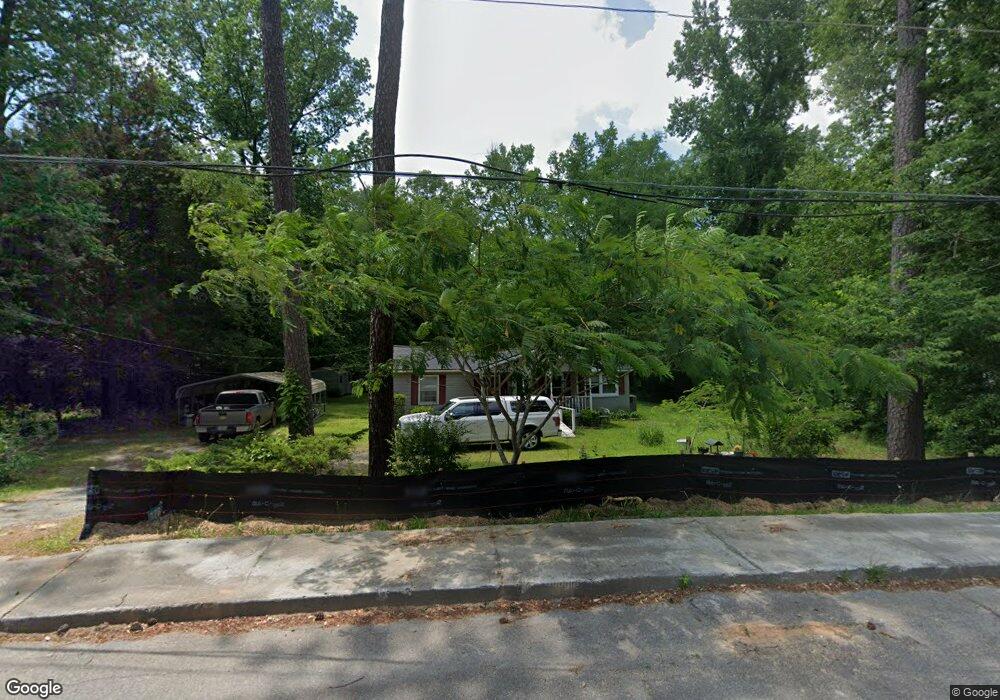
126 Pine Cir Mc Intyre, GA 31054
Estimated Value: $94,568 - $142,000
2
Beds
1
Bath
1,139
Sq Ft
$109/Sq Ft
Est. Value
About This Home
This home is located at 126 Pine Cir, Mc Intyre, GA 31054 and is currently estimated at $124,142, approximately $108 per square foot. 126 Pine Cir is a home located in Wilkinson County with nearby schools including Wilkinson County Primary School, Wilkinson County Elementary School, and Wilkinson County Middle School.
Create a Home Valuation Report for This Property
The Home Valuation Report is an in-depth analysis detailing your home's value as well as a comparison with similar homes in the area
Home Values in the Area
Average Home Value in this Area
Tax History Compared to Growth
Tax History
| Year | Tax Paid | Tax Assessment Tax Assessment Total Assessment is a certain percentage of the fair market value that is determined by local assessors to be the total taxable value of land and additions on the property. | Land | Improvement |
|---|---|---|---|---|
| 2024 | $525 | $28,415 | $3,075 | $25,340 |
| 2023 | $138 | $11,221 | $1,752 | $9,469 |
| 2022 | $130 | $10,821 | $1,752 | $9,069 |
| 2021 | $116 | $10,066 | $1,752 | $8,314 |
| 2020 | $116 | $10,066 | $1,752 | $8,314 |
| 2019 | $116 | $10,066 | $1,752 | $8,314 |
| 2018 | $116 | $10,066 | $1,752 | $8,314 |
| 2017 | $354 | $10,066 | $1,752 | $8,314 |
| 2016 | $354 | $10,066 | $1,752 | $8,314 |
| 2015 | $71 | $9,333 | $1,752 | $7,581 |
| 2014 | $71 | $9,333 | $1,752 | $7,581 |
| 2013 | $71 | $9,333 | $1,752 | $7,580 |
Source: Public Records
Map
Nearby Homes
- 110 Magnolia Dr
- 0 Magnolia Dr
- 0 Davis Cemetery Rd
- 0 Asbell Rd
- --- Asbell Rd
- 9 Sunflower Rd
- 102 Asbell St
- 103 E Main St
- 56 Claymont Rd
- 15110 Georgia 57
- 00 Wriley Rd
- 498 White Springs Church Rd
- C T Lord Hwy
- 88 Caroline Dr
- 0 Us-441 S
- 110 Irwinton Rd
- 0 Industrial Blvd Unit 52833
- 137 Lakeview Dr S
- 0 Hwy 112 Unit 50903
- 0 Hwy 112 Unit LotWP001 24020150