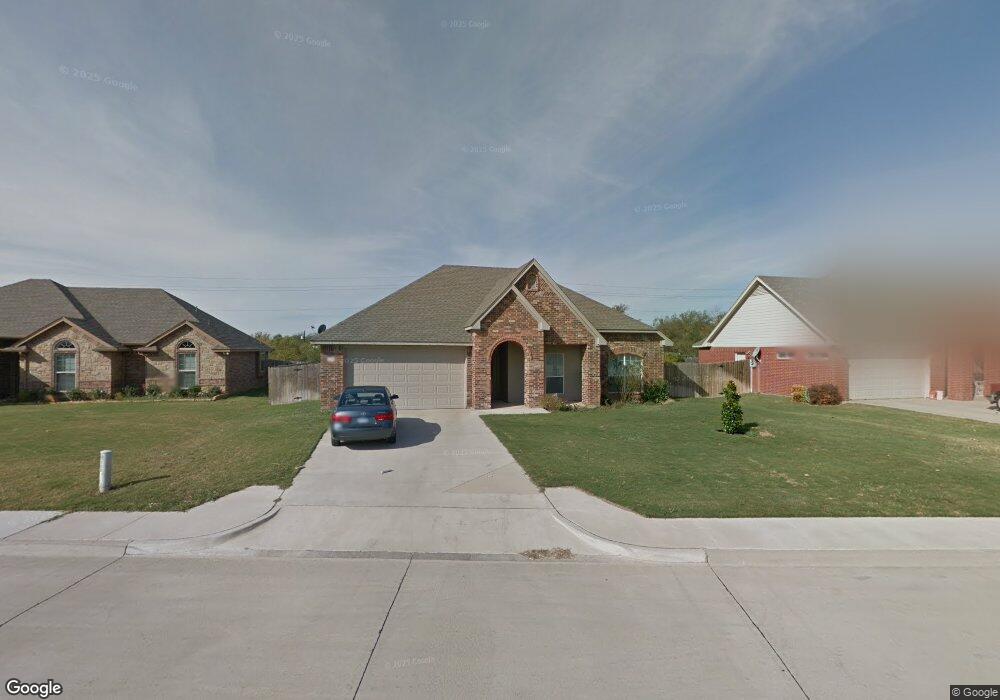
126 Pleasant View Dr Weatherford, TX 76086
Estimated Value: $280,600 - $318,000
3
Beds
2
Baths
1,413
Sq Ft
$211/Sq Ft
Est. Value
About This Home
This home is located at 126 Pleasant View Dr, Weatherford, TX 76086 and is currently estimated at $298,150, approximately $211 per square foot. 126 Pleasant View Dr is a home located in Parker County with nearby schools including Wright Elementary School, Hall Middle School, and Weatherford High School.
Ownership History
Date
Name
Owned For
Owner Type
Purchase Details
Closed on
May 10, 2019
Sold by
Mojica Jose Alejandro and Mojica Flat Angela
Bought by
Apodaca Rodney Codey
Current Estimated Value
Home Financials for this Owner
Home Financials are based on the most recent Mortgage that was taken out on this home.
Original Mortgage
$193,922
Outstanding Balance
$173,108
Interest Rate
4.99%
Mortgage Type
FHA
Estimated Equity
$125,042
Purchase Details
Closed on
Aug 20, 2007
Sold by
Pleasant Valley 2001 Lp
Bought by
Mojica Jose Alejandro
Home Financials for this Owner
Home Financials are based on the most recent Mortgage that was taken out on this home.
Original Mortgage
$128,000
Interest Rate
6.69%
Mortgage Type
New Conventional
Create a Home Valuation Report for This Property
The Home Valuation Report is an in-depth analysis detailing your home's value as well as a comparison with similar homes in the area
Home Values in the Area
Average Home Value in this Area
Purchase History
| Date | Buyer | Sale Price | Title Company |
|---|---|---|---|
| Apodaca Rodney Codey | -- | Providence Title Company | |
| Mojica Jose Alejandro | -- | Stnt |
Source: Public Records
Mortgage History
| Date | Status | Borrower | Loan Amount |
|---|---|---|---|
| Open | Apodaca Rodney Codey | $193,922 | |
| Previous Owner | Mojica Jose Alejandro | $128,000 |
Source: Public Records
Tax History Compared to Growth
Tax History
| Year | Tax Paid | Tax Assessment Tax Assessment Total Assessment is a certain percentage of the fair market value that is determined by local assessors to be the total taxable value of land and additions on the property. | Land | Improvement |
|---|---|---|---|---|
| 2025 | $5,896 | $289,240 | $50,000 | $239,240 |
| 2024 | $5,896 | $305,900 | $40,000 | $265,900 |
| 2023 | $5,896 | $305,900 | $40,000 | $265,900 |
| 2022 | $4,526 | $204,050 | $20,000 | $184,050 |
| 2021 | $4,900 | $204,050 | $20,000 | $184,050 |
| 2020 | $4,421 | $182,980 | $20,000 | $162,980 |
| 2019 | $4,673 | $182,980 | $20,000 | $162,980 |
| 2018 | $4,027 | $157,000 | $20,000 | $137,000 |
| 2017 | $3,915 | $157,000 | $20,000 | $137,000 |
| 2016 | $3,559 | $135,260 | $20,000 | $115,260 |
| 2015 | $3,063 | $135,260 | $20,000 | $115,260 |
| 2014 | -- | $121,120 | $20,000 | $101,120 |
Source: Public Records
Map
Nearby Homes
- 145 Redbud Ln
- 1221 Elmira St
- 115 Harmon St
- 109 Garner Rd
- 1012 Keechi St
- 217 Clinton Dr
- 1105 Palo Pinto St
- 302 Case St
- 819 Norton St
- 1413 Westwood Dr
- 1402 W Water St
- 122 Rachel Rd
- 1442 W Water St
- 220 S Merrimac
- 1318 W Water St
- 1401 W Ball St
- 1525 Oak Tree Cir
- 213 Jefferson St
- 221 Jefferson St
- 208 Jefferson St
- 122 Pleasant View Dr
- 130 Pleasant View Dr
- 118 Pleasant View Dr
- 134 Pleasant View Dr
- 125 Pleasant View Dr
- 129 Pleasant View Dr
- 121 Pleasant View Dr
- 133 Pleasant View Dr
- 114 Pleasant View Dr
- 138 Pleasant View Dr
- 117 Pleasant View Dr
- 202 Pleasant View Dr
- 110 Pleasant View Dr
- 1401 Ranger Hwy Unit 301
- 1401 Ranger Hwy Unit 203
- 1401 Ranger Hwy Unit 202
- 1401 Ranger Hwy Unit 201
- 1401 Ranger Hwy
- 113 Pleasant View Dr
- 144 Redbud Ln