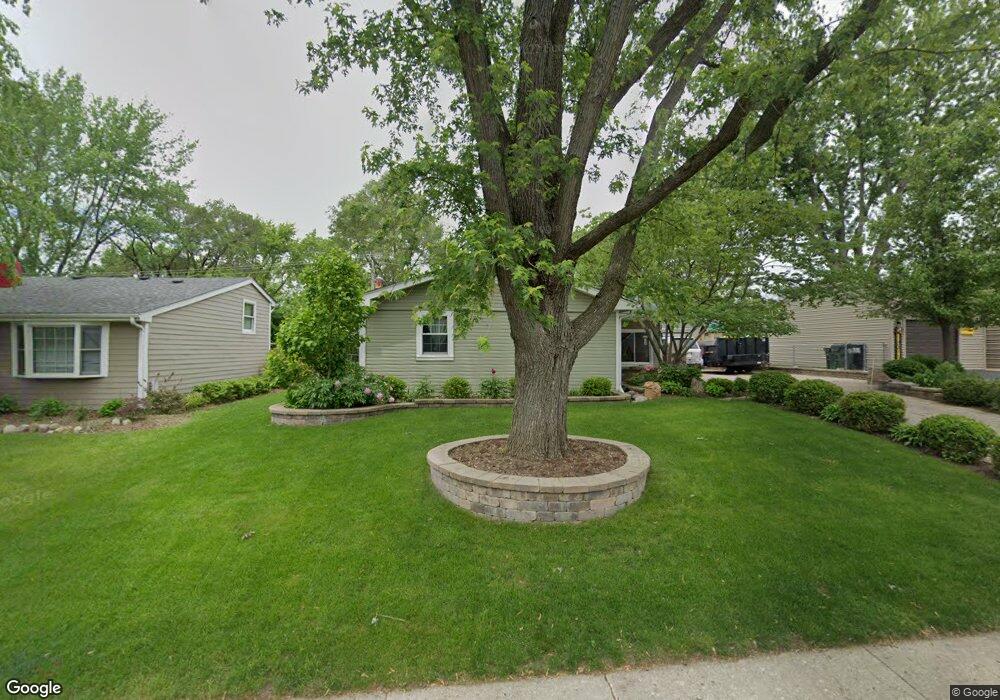
126 Pueblo Rd Carpentersville, IL 60110
Estimated Value: $244,000 - $256,765
3
Beds
--
Bath
1,282
Sq Ft
$194/Sq Ft
Est. Value
About This Home
This home is located at 126 Pueblo Rd, Carpentersville, IL 60110 and is currently estimated at $248,941, approximately $194 per square foot. 126 Pueblo Rd is a home located in Kane County with nearby schools including Perry Elementary School, Carpentersville Middle School, and Dundee-Crown High School.
Ownership History
Date
Name
Owned For
Owner Type
Purchase Details
Closed on
May 29, 2003
Sold by
Monroy Salvador and Monroy Alicia
Bought by
Caballero Armando
Current Estimated Value
Home Financials for this Owner
Home Financials are based on the most recent Mortgage that was taken out on this home.
Original Mortgage
$137,738
Outstanding Balance
$58,670
Interest Rate
5.4%
Mortgage Type
FHA
Estimated Equity
$190,271
Purchase Details
Closed on
May 8, 1998
Sold by
Jacob Joseph
Bought by
Monroy Salvador and Monroy Alicia
Home Financials for this Owner
Home Financials are based on the most recent Mortgage that was taken out on this home.
Original Mortgage
$102,124
Interest Rate
6.95%
Mortgage Type
FHA
Purchase Details
Closed on
Jun 5, 1997
Sold by
Johnson Paul
Bought by
Jacob Joseph Thomas
Home Financials for this Owner
Home Financials are based on the most recent Mortgage that was taken out on this home.
Original Mortgage
$87,700
Interest Rate
8.17%
Mortgage Type
VA
Create a Home Valuation Report for This Property
The Home Valuation Report is an in-depth analysis detailing your home's value as well as a comparison with similar homes in the area
Home Values in the Area
Average Home Value in this Area
Purchase History
| Date | Buyer | Sale Price | Title Company |
|---|---|---|---|
| Caballero Armando | $140,000 | First American Title Ins Co | |
| Monroy Salvador | $105,000 | -- | |
| Jacob Joseph Thomas | $86,000 | -- |
Source: Public Records
Mortgage History
| Date | Status | Borrower | Loan Amount |
|---|---|---|---|
| Open | Caballero Armando | $137,738 | |
| Previous Owner | Monroy Salvador | $102,124 | |
| Previous Owner | Jacob Joseph Thomas | $87,700 |
Source: Public Records
Tax History Compared to Growth
Tax History
| Year | Tax Paid | Tax Assessment Tax Assessment Total Assessment is a certain percentage of the fair market value that is determined by local assessors to be the total taxable value of land and additions on the property. | Land | Improvement |
|---|---|---|---|---|
| 2024 | $5,074 | $75,003 | $12,553 | $62,450 |
| 2023 | $4,998 | $67,485 | $11,295 | $56,190 |
| 2022 | $4,617 | $59,018 | $11,295 | $47,723 |
| 2021 | $4,504 | $55,725 | $10,665 | $45,060 |
| 2020 | $4,428 | $54,472 | $10,425 | $44,047 |
| 2019 | $4,325 | $51,711 | $9,897 | $41,814 |
| 2018 | $4,167 | $47,986 | $9,701 | $38,285 |
| 2017 | $3,989 | $44,889 | $9,075 | $35,814 |
| 2016 | $3,570 | $38,451 | $8,787 | $29,664 |
| 2015 | -- | $29,330 | $8,234 | $21,096 |
| 2014 | -- | $26,322 | $8,007 | $18,315 |
| 2013 | -- | $27,128 | $8,252 | $18,876 |
Source: Public Records
Map
Nearby Homes
- 200 Amarillo Dr
- 105 Siesta Rd
- 308 Amarillo Ct
- 1426 Kings Rd
- 140 Hickory Dr
- 2013 Silverstone Dr Unit 2013
- 1431 Silverstone Dr Unit 1416
- 1811 IL Rte 25 (Elgin) Rd
- 103 Hickory Dr
- 2245 Flagstone Ln Unit 155
- 1309 Silverstone Dr Unit 1305
- 1303 Silverstone Dr Unit 1302
- 713 Silverstone Dr Unit 77
- 171 Lake Shore Dr
- 1551 Glacier Trail Unit 644
- 336 Delaware St
- 149 Austin Ave
- 944 Cortney Dr
- 181 Skyline Dr
- 7 Autumn Trail