Estimated Value: $421,000 - $461,000
5
Beds
3
Baths
2,234
Sq Ft
$200/Sq Ft
Est. Value
About This Home
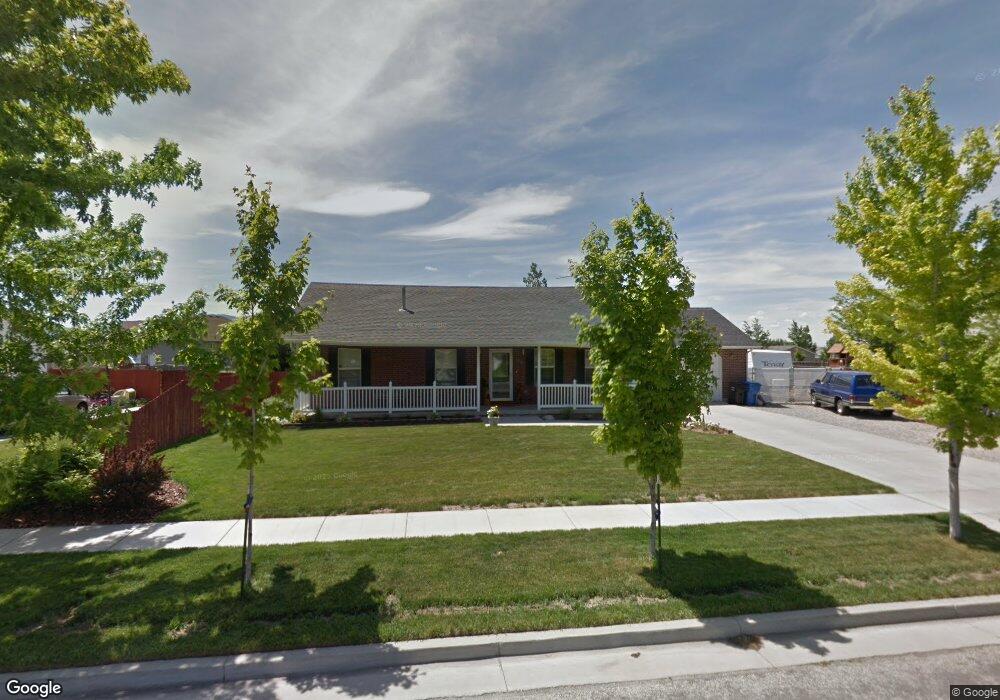
This home is located at 126 S 1250 E, Hyrum, UT 84319 and is currently estimated at $446,217, approximately $199 per square foot. 126 S 1250 E is a home located in Cache County with nearby schools including Canyon School, South Cache Middle School, and Mountain Crest High School.
Ownership History
Date
Name
Owned For
Owner Type
Purchase Details
Closed on
Sep 7, 2017
Sold by
Schmid Lucas Kent
Bought by
Schmid Lucas Kent and Schmid Jesse
Current Estimated Value
Home Financials for this Owner
Home Financials are based on the most recent Mortgage that was taken out on this home.
Original Mortgage
$178,400
Outstanding Balance
$148,619
Interest Rate
3.9%
Mortgage Type
New Conventional
Estimated Equity
$297,598
Purchase Details
Closed on
May 20, 2014
Sold by
Lowry Greg H and Lowry Mireille H
Bought by
Schmid Luke K and Schmid Jesse
Home Financials for this Owner
Home Financials are based on the most recent Mortgage that was taken out on this home.
Original Mortgage
$181,632
Interest Rate
4.31%
Mortgage Type
New Conventional
Create a Home Valuation Report for This Property
The Home Valuation Report is an in-depth analysis detailing your home's value as well as a comparison with similar homes in the area
Home Values in the Area
Average Home Value in this Area
Purchase History
| Date | Buyer | Sale Price | Title Company |
|---|---|---|---|
| Schmid Lucas Kent | -- | American Secure Title | |
| Schmid Lucas Kent | -- | American Secure Title | |
| Schmid Luke K | -- | Advanced Title |
Source: Public Records
Mortgage History
| Date | Status | Borrower | Loan Amount |
|---|---|---|---|
| Open | Schmid Lucas Kent | $178,400 | |
| Closed | Schmid Lucas Kent | $178,400 | |
| Previous Owner | Schmid Luke K | $181,632 |
Source: Public Records
Tax History
| Year | Tax Paid | Tax Assessment Tax Assessment Total Assessment is a certain percentage of the fair market value that is determined by local assessors to be the total taxable value of land and additions on the property. | Land | Improvement |
|---|---|---|---|---|
| 2025 | $1,694 | $243,195 | $0 | $0 |
| 2024 | $1,804 | $241,895 | $0 | $0 |
| 2023 | $1,835 | $235,205 | $0 | $0 |
| 2022 | $1,915 | $235,205 | $0 | $0 |
| 2021 | $19 | $355,115 | $65,000 | $290,115 |
| 2020 | $1,465 | $260,189 | $65,000 | $195,189 |
| 2019 | $1,408 | $235,189 | $40,000 | $195,189 |
| 2018 | $1,298 | $209,730 | $40,000 | $169,730 |
| 2017 | $1,275 | $106,865 | $0 | $0 |
| 2016 | $1,304 | $98,615 | $0 | $0 |
| 2015 | $1,024 | $83,750 | $0 | $0 |
| 2014 | $1,002 | $83,750 | $0 | $0 |
| 2013 | -- | $83,750 | $0 | $0 |
Source: Public Records
Map
Nearby Homes
- 136 S 1250 E
- 116 S 1250 E
- 1215 E Hyrum Blvd
- 146 S 1250 E
- 123 1250 E
- 106 S 1250 E
- 113 S 1250 E
- 89 Wapiti Loop
- 1203 E Hyrum Blvd
- 98 Wapiti Loop
- 103 S 1250 E
- 143 S 1250 E
- 83 Wapiti Loop
- 83 Wapiti Loop Unit 52
- 83 Wapiti Loop Unit 76
- 83 Wapiti Loop Unit 53
- 83 Wapiti Loop Unit 51
- 96 S 1250 E
- 128 S 1300 E
- 104 Wapiti Loop
Your Personal Tour Guide
Ask me questions while you tour the home.