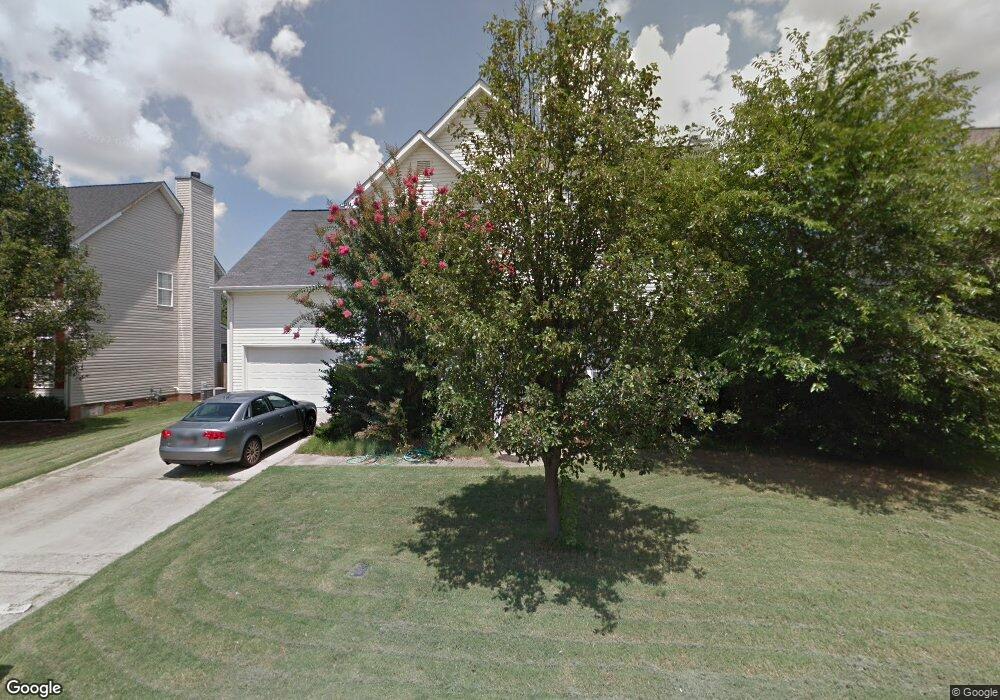
126 Summer Hill Rd Simpsonville, SC 29681
Estimated Value: $421,000 - $499,000
4
Beds
3
Baths
3,145
Sq Ft
$143/Sq Ft
Est. Value
About This Home
This home is located at 126 Summer Hill Rd, Simpsonville, SC 29681 and is currently estimated at $450,159, approximately $143 per square foot. 126 Summer Hill Rd is a home located in Greenville County with nearby schools including Bethel Elementary School, Hillcrest Middle School, and Hillcrest High School.
Ownership History
Date
Name
Owned For
Owner Type
Purchase Details
Closed on
Feb 15, 2017
Sold by
Galloway Jamie R and Galloway Emily
Bought by
Connolly Jonathan M and Connolly Marie E
Current Estimated Value
Purchase Details
Closed on
Sep 26, 2006
Sold by
Rollins Michael E and Rollins Jacquelyn S
Bought by
Phillips Wendell B and Phillips Susan A
Home Financials for this Owner
Home Financials are based on the most recent Mortgage that was taken out on this home.
Original Mortgage
$202,000
Interest Rate
6.48%
Mortgage Type
Purchase Money Mortgage
Purchase Details
Closed on
Mar 16, 2001
Sold by
Branch Banking And Trust Company Of Sout
Bought by
Rollins Jacquelyn S
Purchase Details
Closed on
Mar 14, 2001
Sold by
Hallmark Construction & Development Inc
Bought by
Branch Banking And Trust Company Of Sout
Purchase Details
Closed on
Apr 9, 1999
Sold by
Summerwalk Assoc Llc
Bought by
Hallmark Const & Dev Inc
Create a Home Valuation Report for This Property
The Home Valuation Report is an in-depth analysis detailing your home's value as well as a comparison with similar homes in the area
Home Values in the Area
Average Home Value in this Area
Purchase History
| Date | Buyer | Sale Price | Title Company |
|---|---|---|---|
| Connolly Jonathan M | $255,000 | None Available | |
| Phillips Wendell B | $224,500 | None Available | |
| Rollins Jacquelyn S | $172,500 | -- | |
| Branch Banking And Trust Company Of Sout | $2,500 | -- | |
| Hallmark Const & Dev Inc | $57,800 | -- |
Source: Public Records
Mortgage History
| Date | Status | Borrower | Loan Amount |
|---|---|---|---|
| Previous Owner | Phillips Wendell B | $202,000 |
Source: Public Records
Tax History Compared to Growth
Tax History
| Year | Tax Paid | Tax Assessment Tax Assessment Total Assessment is a certain percentage of the fair market value that is determined by local assessors to be the total taxable value of land and additions on the property. | Land | Improvement |
|---|---|---|---|---|
| 2024 | $1,606 | $10,180 | $1,600 | $8,580 |
| 2023 | $1,606 | $10,180 | $1,600 | $8,580 |
| 2022 | $1,565 | $10,180 | $1,600 | $8,580 |
| 2021 | $1,566 | $10,180 | $1,600 | $8,580 |
| 2020 | $1,496 | $9,250 | $1,120 | $8,130 |
| 2019 | $1,497 | $9,250 | $1,120 | $8,130 |
| 2018 | $1,549 | $9,250 | $1,120 | $8,130 |
| 2017 | $1,551 | $9,250 | $1,120 | $8,130 |
| 2016 | $1,495 | $231,290 | $28,000 | $203,290 |
| 2015 | $1,433 | $222,140 | $26,870 | $195,270 |
| 2014 | $1,196 | $193,170 | $30,000 | $163,170 |
Source: Public Records
Map
Nearby Homes
- 16 Paddock Run Ln
- 206 Sun Shower Way
- 104 Gilden Ln
- 409 Heather Falls Ln
- 120 Lavender Hill Ct Unit Site 6
- 341 Parkside Dr
- 600 Daisy Hill Ln
- 213 Harts Ln
- 204 Staffordshire Way
- 202 Plain Post Trail
- 102 Plain Post Trail
- 220 Plain Post Trail
- 106 Plain Post Trail
- 1 Gilder Trace
- 907 Highway 14
- 6 Mendenhall Ct
- 5 Bathurst Ln
- 108 Brown Ln
- 202 Mornington Ct
- 218 Alender Way
- 128 Summer Hill Rd
- 102 Chenoweth Dr
- 130 Summer Hill Rd
- 122 Summer Hill Rd
- 104 Chenoweth Dr
- 125 Summer Hill Rd
- 123 Summer Hill Rd
- 100 Chenoweth Dr
- 106 Chenoweth Dr
- 121 Summer Hill Rd
- 120 Summer Hill Rd
- 78 Chenoweth Dr
- 119 Summer Hill Rd
- 108 Chenoweth Dr
- 118 Summer Hill Rd
- 210 Carrington Way
- 208 Carrington Way
- 103 Chenoweth Dr
- 314 Summerwalk Place
- 312 Summerwalk Place