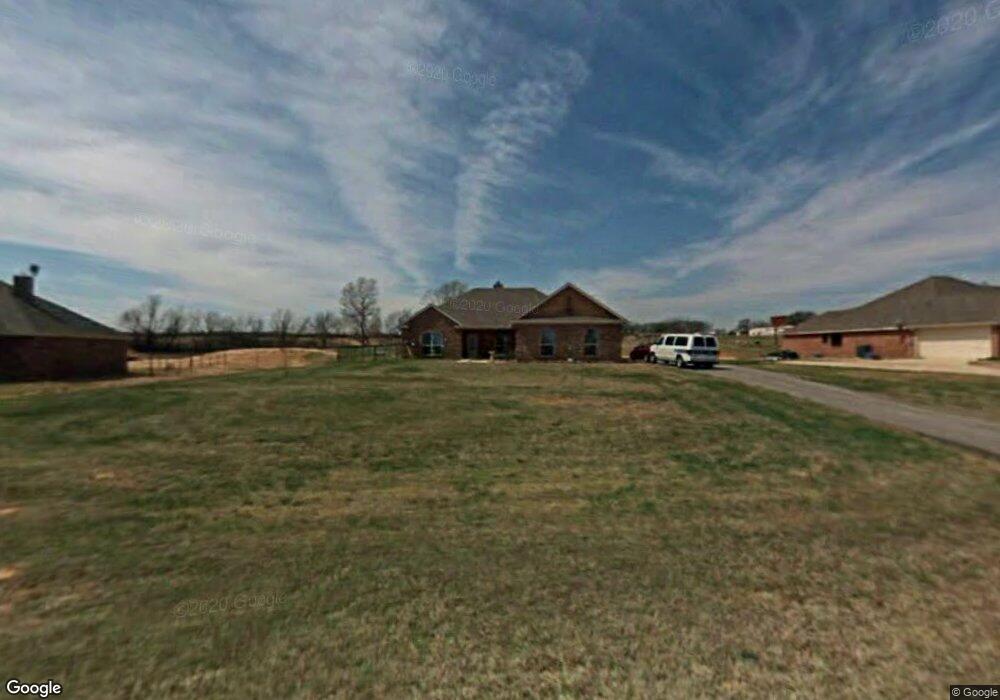
126 Sunray Ct Weatherford, TX 76087
Estimated Value: $395,000 - $446,000
3
Beds
2
Baths
1,943
Sq Ft
$215/Sq Ft
Est. Value
About This Home
This home is located at 126 Sunray Ct, Weatherford, TX 76087 and is currently estimated at $418,199, approximately $215 per square foot. 126 Sunray Ct is a home located in Parker County with nearby schools including Curtis Elementary School, Hall Middle School, and Weatherford High School.
Ownership History
Date
Name
Owned For
Owner Type
Purchase Details
Closed on
Dec 4, 2019
Sold by
Barron Michael Lee and Barron Carrie Lynn
Bought by
Roberson Michael A and Roberson Kelly J
Current Estimated Value
Home Financials for this Owner
Home Financials are based on the most recent Mortgage that was taken out on this home.
Original Mortgage
$208,000
Outstanding Balance
$183,918
Interest Rate
3.75%
Mortgage Type
New Conventional
Estimated Equity
$234,281
Purchase Details
Closed on
Apr 2, 2018
Sold by
Tipton Gary and Tipton Triska
Bought by
Barron Michael Lee and Barron Carrie Lynn
Purchase Details
Closed on
Feb 14, 2006
Sold by
Rapkoch John T
Bought by
Tipton Gary
Home Financials for this Owner
Home Financials are based on the most recent Mortgage that was taken out on this home.
Original Mortgage
$146,205
Interest Rate
6.1%
Mortgage Type
FHA
Purchase Details
Closed on
Aug 17, 2005
Bought by
Tipton Gary
Create a Home Valuation Report for This Property
The Home Valuation Report is an in-depth analysis detailing your home's value as well as a comparison with similar homes in the area
Home Values in the Area
Average Home Value in this Area
Purchase History
| Date | Buyer | Sale Price | Title Company |
|---|---|---|---|
| Roberson Michael A | -- | None Available | |
| Barron Michael Lee | -- | None Available | |
| Tipton Gary | -- | Stnt | |
| Tipton Gary | -- | -- |
Source: Public Records
Mortgage History
| Date | Status | Borrower | Loan Amount |
|---|---|---|---|
| Open | Roberson Michael A | $208,000 | |
| Previous Owner | Tipton Gary | $146,205 |
Source: Public Records
Tax History Compared to Growth
Tax History
| Year | Tax Paid | Tax Assessment Tax Assessment Total Assessment is a certain percentage of the fair market value that is determined by local assessors to be the total taxable value of land and additions on the property. | Land | Improvement |
|---|---|---|---|---|
| 2025 | $4,773 | $392,222 | -- | -- |
| 2024 | $4,773 | $356,565 | -- | -- |
| 2023 | $4,773 | $324,150 | $0 | $0 |
| 2022 | $5,487 | $294,690 | $50,000 | $244,690 |
| 2021 | $5,660 | $294,690 | $50,000 | $244,690 |
| 2020 | $5,171 | $254,930 | $30,000 | $224,930 |
| 2019 | $5,516 | $254,930 | $30,000 | $224,930 |
| 2018 | $4,795 | $222,890 | $25,000 | $197,890 |
| 2017 | $4,448 | $222,890 | $25,000 | $197,890 |
| 2016 | $4,044 | $182,190 | $25,000 | $157,190 |
| 2015 | $3,621 | $182,190 | $25,000 | $157,190 |
| 2014 | $3,248 | $170,760 | $25,000 | $145,760 |
Source: Public Records
Map
Nearby Homes
- TBD Harmony Rd
- 130 Sunburst Ct
- 566 Harmony Rd
- 269 Harmony Rd
- 622 Harmony Cir
- 8135 Floor Plan at Old Oaks
- 8136 Floor Plan at Old Oaks
- 8137 Floor Plan at Old Oaks
- 8130 Floor Plan at Old Oaks
- 8125 Floor Plan at Old Oaks
- 8108 EP Floor Plan at Old Oaks
- 8126 Floor Plan at Old Oaks
- 8113 Floor Plan at Old Oaks
- 8121 Floor Plan at Old Oaks
- 1009 Old Oaks Ct
- 1041 Old Oaks Ct
- 1008 Old Oaks Ct
- 1170 Harmony Cir
- 119 Greenbriar St
- 1252 Harmony Cir