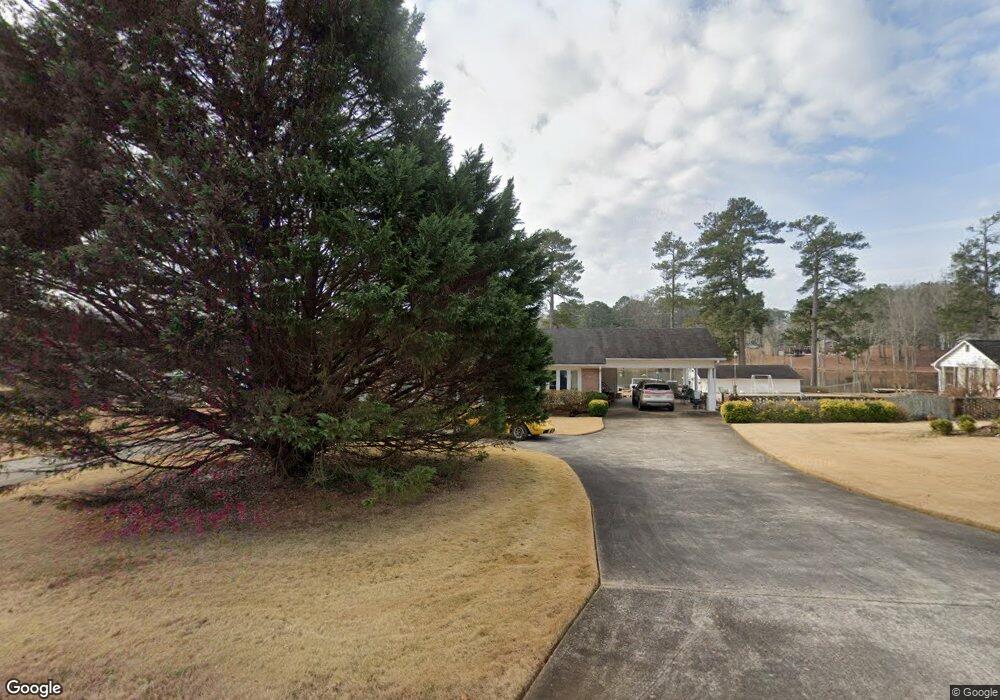
126 Thomas St Griffin, GA 30224
Spalding County NeighborhoodEstimated Value: $299,000 - $344,000
3
Beds
2
Baths
2,424
Sq Ft
$134/Sq Ft
Est. Value
About This Home
This home is located at 126 Thomas St, Griffin, GA 30224 and is currently estimated at $323,627, approximately $133 per square foot. 126 Thomas St is a home located in Spalding County with nearby schools including Crescent Road Elementary School, Rehoboth Road Middle School, and Spalding High School.
Ownership History
Date
Name
Owned For
Owner Type
Purchase Details
Closed on
Dec 11, 2017
Sold by
Mangum V John V
Bought by
Garner Brenda
Current Estimated Value
Purchase Details
Closed on
Jan 28, 2009
Sold by
Killingsworth C T and Killingsworth Mary L
Bought by
Mangum John and Mangum Migdalia E
Home Financials for this Owner
Home Financials are based on the most recent Mortgage that was taken out on this home.
Original Mortgage
$162,418
Interest Rate
5.24%
Mortgage Type
VA
Purchase Details
Closed on
Apr 11, 1991
Sold by
Peterson Peterson H and Peterson Sara F
Bought by
Killingsworth C T
Purchase Details
Closed on
Apr 29, 1983
Sold by
Elkins John T and Sylvia Jane
Bought by
Peterson Peterson H and Peterson Sara F
Purchase Details
Closed on
Mar 22, 1971
Sold by
Mathis O N
Bought by
Elkins John T and Sylvia Jane
Purchase Details
Closed on
Apr 13, 1934
Bought by
Mathis O N
Create a Home Valuation Report for This Property
The Home Valuation Report is an in-depth analysis detailing your home's value as well as a comparison with similar homes in the area
Home Values in the Area
Average Home Value in this Area
Purchase History
| Date | Buyer | Sale Price | Title Company |
|---|---|---|---|
| Garner Brenda | $175,000 | -- | |
| Mangum John | $159,000 | -- | |
| Killingsworth C T | $105,000 | -- | |
| Peterson Peterson H | $84,700 | -- | |
| Elkins John T | $4,000 | -- | |
| Mathis O N | -- | -- |
Source: Public Records
Mortgage History
| Date | Status | Borrower | Loan Amount |
|---|---|---|---|
| Previous Owner | Mangum John | $162,418 |
Source: Public Records
Tax History
| Year | Tax Paid | Tax Assessment Tax Assessment Total Assessment is a certain percentage of the fair market value that is determined by local assessors to be the total taxable value of land and additions on the property. | Land | Improvement |
|---|---|---|---|---|
| 2025 | $2,532 | $120,965 | $16,000 | $104,965 |
| 2024 | $2,522 | $120,965 | $16,000 | $104,965 |
| 2023 | $598 | $79,809 | $15,000 | $64,809 |
| 2022 | $380 | $71,580 | $12,000 | $59,580 |
| 2021 | $726 | $64,255 | $12,000 | $52,255 |
| 2020 | $2,199 | $60,252 | $12,000 | $48,252 |
| 2019 | $2,205 | $59,252 | $12,000 | $47,252 |
| 2018 | $2,224 | $58,196 | $12,000 | $46,196 |
| 2017 | $2,078 | $55,785 | $12,000 | $43,785 |
| 2016 | $2,183 | $57,691 | $12,000 | $45,691 |
| 2015 | $2,248 | $57,691 | $12,000 | $45,691 |
| 2014 | $2,293 | $57,691 | $12,000 | $45,691 |
Source: Public Records
Map
Nearby Homes
- 110 Kline Cir
- 1374 Zebulon Rd
- 1366 Zebulon Rd
- 105 Jewel Dr
- 1522 Zebulon Rd
- 7 Crabapple Cir
- 1226 Zebulon Rd
- 210 Laurel St
- 211 Clark Rd
- 112 Oak Ave SW
- 236 Airport Rd
- 220 Airport Rd
- 133 Coldwater Ln
- 1077 Coldwater Dr
- 138 Townsend Ct
- 119 Townsend Ct
- 135 Townsend Ct
- 1133 Birchwood Dr Unit 29
- 1082 Coldwater Dr
- TRACT B Zebulon Rd
Your Personal Tour Guide
Ask me questions while you tour the home.