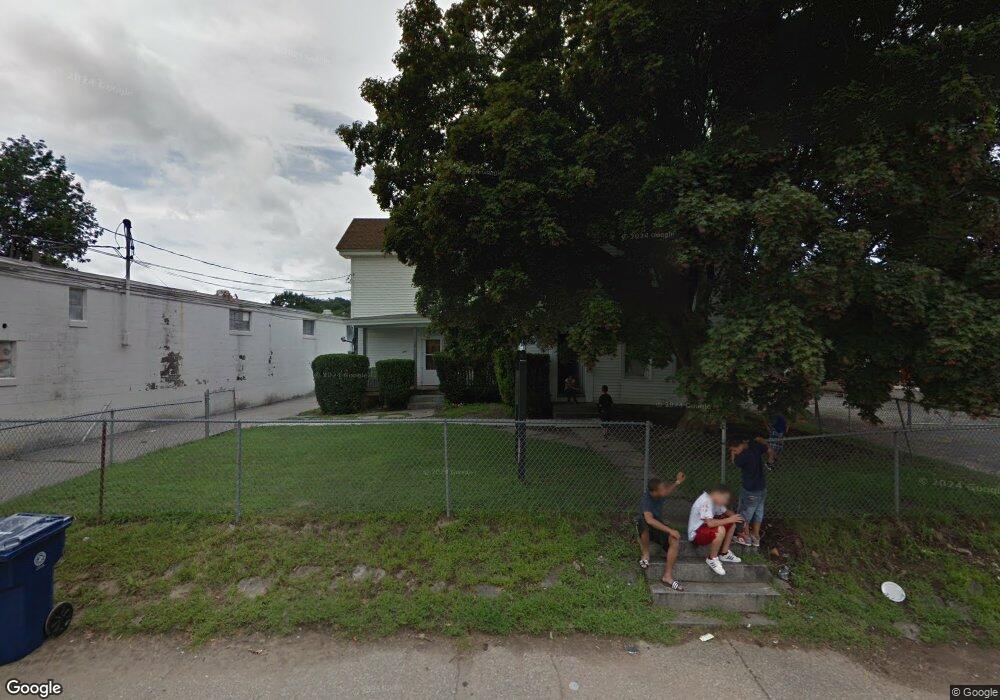
126 Union St Willimantic, CT 06226
Estimated Value: $289,000 - $314,000
5
Beds
3
Baths
2,744
Sq Ft
$109/Sq Ft
Est. Value
About This Home
This home is located at 126 Union St, Willimantic, CT 06226 and is currently estimated at $298,000, approximately $108 per square foot. 126 Union St is a home located in Windham County with nearby schools including Windham Middle School, Windham High School, and Oak Grove Montessori School.
Ownership History
Date
Name
Owned For
Owner Type
Purchase Details
Closed on
Oct 26, 2010
Sold by
Guaranteed Quality Llc
Bought by
Hazley John L
Current Estimated Value
Purchase Details
Closed on
Oct 13, 1995
Sold by
Fnma
Bought by
Roenighk Martin
Purchase Details
Closed on
Jun 29, 1988
Sold by
Coulombe Jean
Bought by
Barron Paul
Home Financials for this Owner
Home Financials are based on the most recent Mortgage that was taken out on this home.
Original Mortgage
$116,000
Interest Rate
10.47%
Mortgage Type
Purchase Money Mortgage
Create a Home Valuation Report for This Property
The Home Valuation Report is an in-depth analysis detailing your home's value as well as a comparison with similar homes in the area
Home Values in the Area
Average Home Value in this Area
Purchase History
| Date | Buyer | Sale Price | Title Company |
|---|---|---|---|
| Hazley John L | -- | -- | |
| Roenighk Martin | $30,000 | -- | |
| Barron Paul | $145,000 | -- |
Source: Public Records
Mortgage History
| Date | Status | Borrower | Loan Amount |
|---|---|---|---|
| Previous Owner | Barron Paul | $116,000 |
Source: Public Records
Tax History
| Year | Tax Paid | Tax Assessment Tax Assessment Total Assessment is a certain percentage of the fair market value that is determined by local assessors to be the total taxable value of land and additions on the property. | Land | Improvement |
|---|---|---|---|---|
| 2025 | $5,649 | $152,580 | $20,690 | $131,890 |
| 2024 | $5,495 | $148,260 | $20,690 | $127,570 |
| 2023 | $3,903 | $82,340 | $18,000 | $64,340 |
| 2022 | $3,845 | $82,340 | $18,000 | $64,340 |
| 2021 | $4,124 | $82,340 | $18,000 | $64,340 |
| 2020 | $4,115 | $82,340 | $18,000 | $64,340 |
| 2019 | $4,049 | $82,340 | $18,000 | $64,340 |
| 2017 | $3,460 | $72,680 | $19,290 | $53,390 |
| 2015 | $2,497 | $72,680 | $19,290 | $53,390 |
| 2014 | $3,156 | $72,680 | $19,290 | $53,390 |
Source: Public Records
Map
Nearby Homes
Your Personal Tour Guide
Ask me questions while you tour the home.