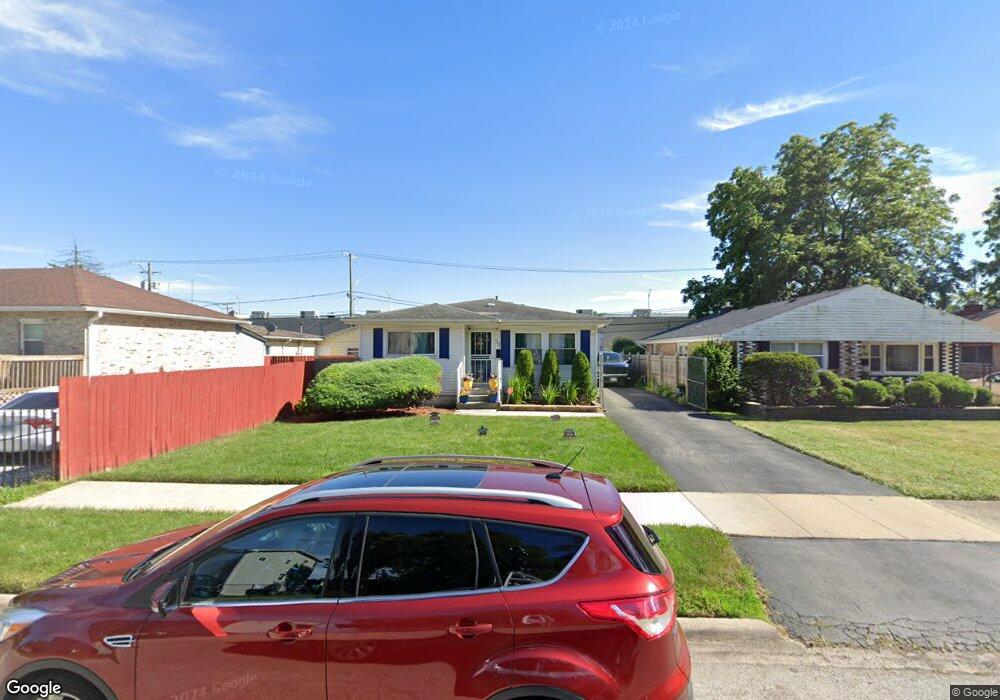
126 W 158th Place Harvey, IL 60426
Estimated Value: $90,352 - $170,000
3
Beds
2
Baths
1,150
Sq Ft
$106/Sq Ft
Est. Value
About This Home
This home is located at 126 W 158th Place, Harvey, IL 60426 and is currently estimated at $121,588, approximately $105 per square foot. 126 W 158th Place is a home located in Cook County with nearby schools including Maya Angelou Elementary School, Brooks Middle School, and Thornton Township High School.
Ownership History
Date
Name
Owned For
Owner Type
Purchase Details
Closed on
Aug 18, 2006
Sold by
Wilkins Deric and Wilkins Angela
Bought by
Washington Cory E
Current Estimated Value
Purchase Details
Closed on
Jul 25, 2005
Sold by
Varanauski Joe
Bought by
Wilkins Deric and Wilkins Angela
Home Financials for this Owner
Home Financials are based on the most recent Mortgage that was taken out on this home.
Original Mortgage
$65,000
Interest Rate
6.75%
Mortgage Type
Construction
Purchase Details
Closed on
Mar 30, 2005
Sold by
Thomas Janet
Bought by
Varanauski Joe
Purchase Details
Closed on
Oct 18, 1994
Sold by
Bankers Trust Co Of California Na
Bought by
Murphy Barbara
Purchase Details
Closed on
Aug 19, 1994
Sold by
Murphy Barbara
Bought by
Thomas Janet
Purchase Details
Closed on
Aug 27, 1992
Sold by
Va
Bought by
Bankers Trust Company Of California Na and Vendee Mtg Trust 1992-2
Create a Home Valuation Report for This Property
The Home Valuation Report is an in-depth analysis detailing your home's value as well as a comparison with similar homes in the area
Home Values in the Area
Average Home Value in this Area
Purchase History
| Date | Buyer | Sale Price | Title Company |
|---|---|---|---|
| Washington Cory E | $121,000 | First American Title Ins Co | |
| Wilkins Deric | $62,000 | Multiple | |
| Varanauski Joe | $25,000 | -- | |
| Murphy Barbara | -- | -- | |
| Thomas Janet | -- | -- | |
| Bankers Trust Company Of California Na | -- | -- |
Source: Public Records
Mortgage History
| Date | Status | Borrower | Loan Amount |
|---|---|---|---|
| Previous Owner | Wilkins Deric | $65,000 |
Source: Public Records
Tax History Compared to Growth
Tax History
| Year | Tax Paid | Tax Assessment Tax Assessment Total Assessment is a certain percentage of the fair market value that is determined by local assessors to be the total taxable value of land and additions on the property. | Land | Improvement |
|---|---|---|---|---|
| 2024 | $1,297 | $5,300 | $1,609 | $3,691 |
| 2023 | $746 | $5,300 | $1,609 | $3,691 |
| 2022 | $746 | $4,339 | $1,609 | $2,730 |
| 2021 | $792 | $4,338 | $1,608 | $2,730 |
| 2020 | $997 | $4,338 | $1,608 | $2,730 |
| 2019 | $1,416 | $5,254 | $1,462 | $3,792 |
| 2018 | $1,377 | $5,254 | $1,462 | $3,792 |
| 2017 | $1,390 | $5,254 | $1,462 | $3,792 |
| 2016 | $2,326 | $6,091 | $1,316 | $4,775 |
| 2015 | $2,156 | $6,091 | $1,316 | $4,775 |
| 2014 | $2,184 | $6,091 | $1,316 | $4,775 |
| 2013 | $2,575 | $6,863 | $1,316 | $5,547 |
Source: Public Records
Map
Nearby Homes
- 15812 Lincoln Ave
- 15804 Hoyne Ave
- 16019 Wood St
- 15711 Dixie Hwy
- 15944 Paulina St
- 189 W 156th Place
- 15545 Lincoln Ave
- 2220 W 158th St
- 15734 Marshfield Ave
- 16145 Honore Ave
- 15702 Marshfield Ave
- 16154 Wood St
- 16118 Paulina St
- 112 W 155th St
- 15603 Marshfield Ave
- 1848 W 163rd St
- 16122 Ashland Ave
- 15427 Winchester Ave
- 15422 Lincoln Ave
- 16300 Winchester Ave
- 15836 Lincoln Ave
- 15830 Lincoln Ave
- 130 W 158th Place
- 134 W 158th Place
- 123 W 159th St
- 15816 Lincoln Ave
- 145 W 159th St
- 129 W 158th Place
- 133 W 158th Place
- 137 W 158th Place
- 15831 Lincoln Ave
- 141 W 158th Place
- 119 W 158th Place
- 145W W 158th Place
- 117 W 158th Place
- 15804 Lincoln Ave
- 158 W 158th Place
- 149 W 158th Place
- 108 W 158th Place
- 115 W 158th Place