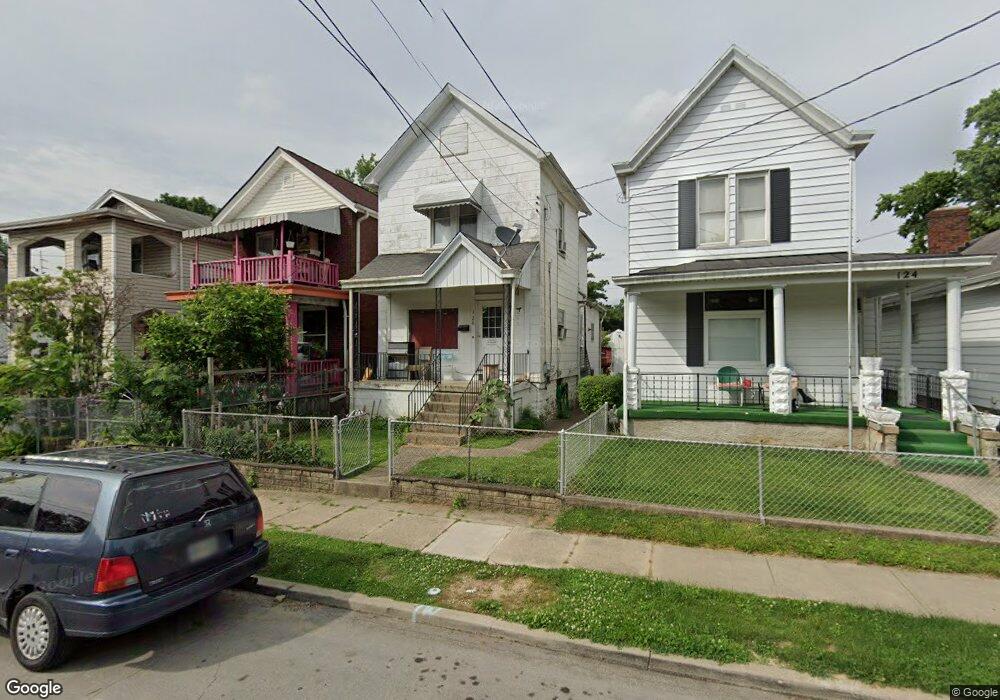
126 W 69th St Cincinnati, OH 45216
Carthage NeighborhoodEstimated Value: $112,000 - $367,000
3
Beds
3
Baths
1,300
Sq Ft
$162/Sq Ft
Est. Value
About This Home
This home is located at 126 W 69th St, Cincinnati, OH 45216 and is currently estimated at $211,058, approximately $162 per square foot. 126 W 69th St is a home located in Hamilton County with nearby schools including Rising Stars at Carthage, Hartwell School, and Shroder High School.
Ownership History
Date
Name
Owned For
Owner Type
Purchase Details
Closed on
Mar 18, 2011
Sold by
Pnc Mortgage
Bought by
He Qiming
Current Estimated Value
Purchase Details
Closed on
Jun 15, 2010
Sold by
Wesley Molita M
Bought by
Pnc Mortgage
Purchase Details
Closed on
Dec 14, 2001
Sold by
Jpl Properties
Bought by
Wesley Molita M
Purchase Details
Closed on
Aug 1, 2001
Sold by
Ann Ingold Mary and Ann Glenn
Bought by
Jpl Properties
Home Financials for this Owner
Home Financials are based on the most recent Mortgage that was taken out on this home.
Original Mortgage
$50,000
Interest Rate
7.23%
Purchase Details
Closed on
Dec 2, 1998
Sold by
Mercer Mable Hughes and Hughes Mable M
Bought by
Ingold Mary Ann
Create a Home Valuation Report for This Property
The Home Valuation Report is an in-depth analysis detailing your home's value as well as a comparison with similar homes in the area
Home Values in the Area
Average Home Value in this Area
Purchase History
| Date | Buyer | Sale Price | Title Company |
|---|---|---|---|
| He Qiming | $14,000 | Attorney | |
| Pnc Mortgage | $38,000 | Attorney | |
| Wesley Molita M | $59,900 | -- | |
| Jpl Properties | $50,000 | -- | |
| Ingold Mary Ann | -- | -- |
Source: Public Records
Mortgage History
| Date | Status | Borrower | Loan Amount |
|---|---|---|---|
| Previous Owner | Jpl Properties | $50,000 |
Source: Public Records
Tax History
| Year | Tax Paid | Tax Assessment Tax Assessment Total Assessment is a certain percentage of the fair market value that is determined by local assessors to be the total taxable value of land and additions on the property. | Land | Improvement |
|---|---|---|---|---|
| 2025 | $1,209 | $18,862 | $5,859 | $13,003 |
| 2023 | $1,210 | $18,862 | $5,859 | $13,003 |
| 2022 | $853 | $11,897 | $3,140 | $8,757 |
| 2021 | $834 | $11,897 | $3,140 | $8,757 |
| 2020 | $837 | $11,897 | $3,140 | $8,757 |
| 2019 | $793 | $10,256 | $2,706 | $7,550 |
| 2018 | $794 | $10,256 | $2,706 | $7,550 |
| 2017 | $764 | $10,256 | $2,706 | $7,550 |
| 2016 | $380 | $4,900 | $3,605 | $1,295 |
| 2015 | $340 | $4,900 | $3,605 | $1,295 |
| 2014 | $342 | $4,900 | $3,605 | $1,295 |
| 2013 | $347 | $4,900 | $3,605 | $1,295 |
Source: Public Records
Map
Nearby Homes
- 206 W 69th St
- 120 W Seventy Second St
- 107 W Sixty Fifth St
- 6605 Hasler Ln
- 121 64th St
- 3 W 73rd St
- 6310 Vine St
- 524 Maple St
- 118 W North Bend Rd
- 1 Spruce St
- 412 Walnut St
- 302 Walnut St
- 215 Walnut St
- 1139 Towanda Terrace
- 5914 Elmwood Ave
- 14 Township Ave
- 0 Township Road 111
- 1117 W Seymour Ave
- 8081 Woodbine Ave
- 1522 Kenova Ave
Your Personal Tour Guide
Ask me questions while you tour the home.