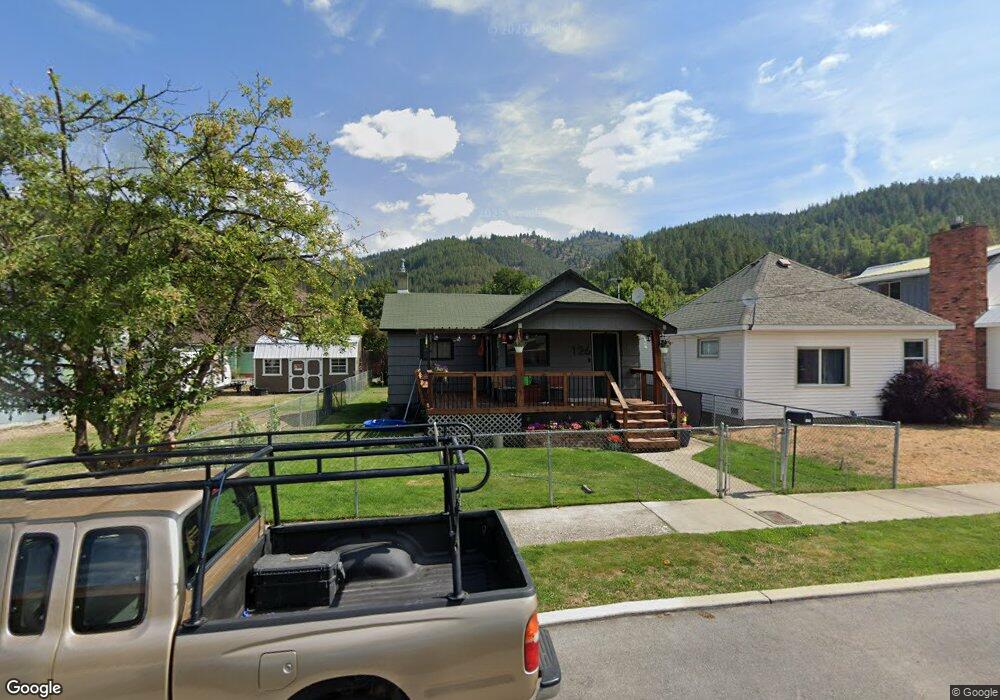
126 W Mullan Ave Kellogg, ID 83837
Estimated Value: $238,000 - $316,000
3
Beds
1
Bath
1,624
Sq Ft
$164/Sq Ft
Est. Value
About This Home
This home is located at 126 W Mullan Ave, Kellogg, ID 83837 and is currently estimated at $266,072, approximately $163 per square foot. 126 W Mullan Ave is a home located in Shoshone County with nearby schools including Pinehurst Elementary School, Kellogg Middle School, and Kellogg High School.
Ownership History
Date
Name
Owned For
Owner Type
Purchase Details
Closed on
Aug 23, 2021
Sold by
Dandrea Robin
Bought by
Dandrea Robin and Dandrea Rusty J
Current Estimated Value
Home Financials for this Owner
Home Financials are based on the most recent Mortgage that was taken out on this home.
Original Mortgage
$89,540
Outstanding Balance
$81,297
Interest Rate
2.8%
Mortgage Type
FHA
Estimated Equity
$184,775
Purchase Details
Closed on
Apr 29, 2014
Sold by
Dandrea Rusty J
Bought by
Dandrea Robin
Home Financials for this Owner
Home Financials are based on the most recent Mortgage that was taken out on this home.
Original Mortgage
$43,498
Interest Rate
4.28%
Purchase Details
Closed on
Apr 18, 2014
Sold by
Kurz Garland L and Kurz Kimberly A
Bought by
Andrea Robin D
Home Financials for this Owner
Home Financials are based on the most recent Mortgage that was taken out on this home.
Original Mortgage
$43,498
Interest Rate
4.28%
Create a Home Valuation Report for This Property
The Home Valuation Report is an in-depth analysis detailing your home's value as well as a comparison with similar homes in the area
Home Values in the Area
Average Home Value in this Area
Purchase History
| Date | Buyer | Sale Price | Title Company |
|---|---|---|---|
| Dandrea Robin | -- | Alliance Title Boise Product | |
| Dandrea Robin | -- | First American Title Co | |
| Andrea Robin D | -- | First American Title Co |
Source: Public Records
Mortgage History
| Date | Status | Borrower | Loan Amount |
|---|---|---|---|
| Open | Dandrea Robin | $89,540 | |
| Closed | Andrea Robin D | $43,498 |
Source: Public Records
Tax History Compared to Growth
Tax History
| Year | Tax Paid | Tax Assessment Tax Assessment Total Assessment is a certain percentage of the fair market value that is determined by local assessors to be the total taxable value of land and additions on the property. | Land | Improvement |
|---|---|---|---|---|
| 2025 | $991 | $203,684 | $76,775 | $126,909 |
| 2024 | $991 | $203,684 | $76,775 | $126,909 |
| 2023 | $991 | $177,969 | $70,347 | $107,622 |
| 2022 | $1,070 | $155,615 | $65,108 | $90,507 |
| 2021 | $1,038 | $107,146 | $24,867 | $82,279 |
| 2020 | $885 | $87,880 | $23,167 | $64,713 |
| 2019 | $828 | $74,725 | $18,811 | $55,914 |
| 2018 | $789 | $61,213 | $17,101 | $44,112 |
| 2017 | $736 | $57,696 | $17,101 | $40,595 |
| 2016 | $724 | $54,941 | $17,101 | $37,840 |
| 2015 | -- | $54,941 | $17,101 | $37,840 |
| 2014 | -- | $50,951 | $17,101 | $33,850 |
Source: Public Records
Map
Nearby Homes
- 130 W Mullan Ave
- 138 W Riverside Ave
- NKA Riverside Ave W
- 110 Morning Star Dr Unit 159
- 110 Morning Star Dr Unit 332
- 150 Morning Star Dr Unit 371
- 150 Morning Star Dr Unit 379
- 150 Morning Star Dr Unit 381
- 150 Morning Star Dr Unit 292
- 0 Vergobbi Unit 25-4752
- 316 W Mission Ave
- 316 W Brown Ave
- 404 Mullan Ave W
- 411 W Mullan Ave
- 140 Railroad Ave Units 1-5
- 140 Railroad Ave Unit 6
- 140 Railroad Ave
- 140 Railroad Ave Unit 5
- 140 Railroad Ave Unit 4
- 140 Railroad Ave Unit 3
- 128 W Mullan Ave
- 124 W Mullan Ave
- 128 W Mullan Ave
- 122 W Mullan Ave
- 132 W Mullan Ave
- 129 W Mission Ave
- 129 W Mission Ave
- 120 W Mullan Ave
- 125 W Mullan Ave
- 123 W Mullan Ave
- 134 W Mullan Ave
- 133 W Mission Ave
- 127 W Mullan Ave
- 135 W Mission Ave
- 121 W Mullan Ave
- 137 W Mullan Ave
- 129 W Mullan Ave
- 116 W Mullan Ave
- 136 W Mullan Ave
- 137 W Mission Ave