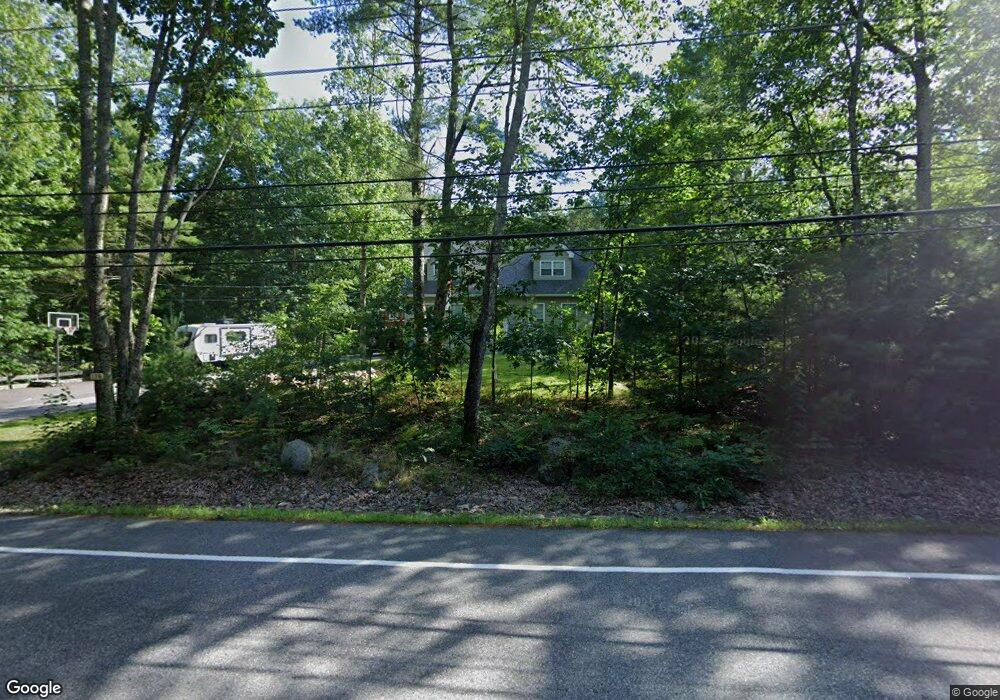
126 West St Biddeford, ME 04005
South Biddeford NeighborhoodEstimated Value: $501,000 - $613,283
3
Beds
3
Baths
2,016
Sq Ft
$286/Sq Ft
Est. Value
About This Home
This home is located at 126 West St, Biddeford, ME 04005 and is currently estimated at $577,071, approximately $286 per square foot. 126 West St is a home with nearby schools including John F Kennedy Memorial School, Biddeford Primary School, and Biddeford Intermediate School.
Ownership History
Date
Name
Owned For
Owner Type
Purchase Details
Closed on
Aug 7, 2017
Sold by
Schiavi Homes Llc
Bought by
Russo Justin T and Russo Stacey L
Current Estimated Value
Home Financials for this Owner
Home Financials are based on the most recent Mortgage that was taken out on this home.
Original Mortgage
$228,000
Outstanding Balance
$189,940
Interest Rate
3.9%
Mortgage Type
New Conventional
Estimated Equity
$387,131
Purchase Details
Closed on
Jan 9, 2017
Sold by
Dumont Monique
Bought by
Schiavi Homes Llc
Create a Home Valuation Report for This Property
The Home Valuation Report is an in-depth analysis detailing your home's value as well as a comparison with similar homes in the area
Home Values in the Area
Average Home Value in this Area
Purchase History
| Date | Buyer | Sale Price | Title Company |
|---|---|---|---|
| Russo Justin T | -- | -- | |
| Schiavi Homes Llc | -- | -- |
Source: Public Records
Mortgage History
| Date | Status | Borrower | Loan Amount |
|---|---|---|---|
| Open | Russo Justin T | $228,000 |
Source: Public Records
Tax History Compared to Growth
Tax History
| Year | Tax Paid | Tax Assessment Tax Assessment Total Assessment is a certain percentage of the fair market value that is determined by local assessors to be the total taxable value of land and additions on the property. | Land | Improvement |
|---|---|---|---|---|
| 2024 | $6,233 | $438,300 | $174,700 | $263,600 |
| 2023 | $5,710 | $435,200 | $171,600 | $263,600 |
| 2022 | $5,258 | $320,400 | $96,600 | $223,800 |
| 2021 | $4,980 | $273,200 | $81,900 | $191,300 |
| 2020 | $4,974 | $248,100 | $74,300 | $173,800 |
| 2019 | $4,945 | $247,500 | $74,300 | $173,200 |
| 2018 | $4,876 | $247,500 | $74,300 | $173,200 |
| 2017 | $1,341 | $66,800 | $66,800 | $0 |
| 2016 | $1,327 | $66,800 | $66,800 | $0 |
Source: Public Records
Map
Nearby Homes