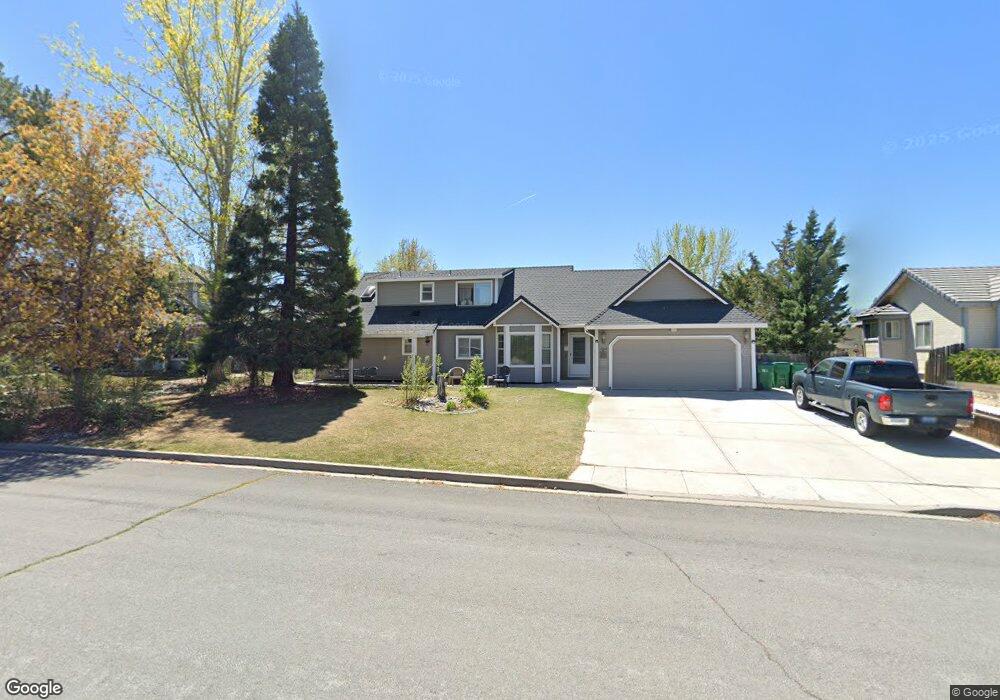
1260 High Chaparral Dr Unit 3B Reno, NV 89521
Virginia Foothills NeighborhoodEstimated Value: $706,000 - $783,000
3
Beds
3
Baths
2,221
Sq Ft
$339/Sq Ft
Est. Value
About This Home
This home is located at 1260 High Chaparral Dr Unit 3B, Reno, NV 89521 and is currently estimated at $753,876, approximately $339 per square foot. 1260 High Chaparral Dr Unit 3B is a home located in Washoe County with nearby schools including Brown Elementary School, Marce Herz Middle School, and Galena High School.
Ownership History
Date
Name
Owned For
Owner Type
Purchase Details
Closed on
Sep 4, 2013
Sold by
Creech Eugene
Bought by
Ellis Ronald and Ellis Frances
Current Estimated Value
Purchase Details
Closed on
Sep 2, 2011
Sold by
Newell Steven and Newell David S
Bought by
Ellis Ronald S and Ellis Frances P
Home Financials for this Owner
Home Financials are based on the most recent Mortgage that was taken out on this home.
Original Mortgage
$192,492
Interest Rate
4.37%
Mortgage Type
FHA
Purchase Details
Closed on
Mar 22, 2005
Sold by
Bedell Charles C and Tieslau Pamela J
Bought by
Newell Steven and Newell David S
Home Financials for this Owner
Home Financials are based on the most recent Mortgage that was taken out on this home.
Original Mortgage
$350,000
Interest Rate
5.53%
Mortgage Type
Unknown
Create a Home Valuation Report for This Property
The Home Valuation Report is an in-depth analysis detailing your home's value as well as a comparison with similar homes in the area
Home Values in the Area
Average Home Value in this Area
Purchase History
| Date | Buyer | Sale Price | Title Company |
|---|---|---|---|
| Ellis Ronald | -- | None Available | |
| Ellis Ronald S | $197,500 | Western Title Company | |
| Newell Steven | $465,000 | Ticor Title Of Nevada Inc |
Source: Public Records
Mortgage History
| Date | Status | Borrower | Loan Amount |
|---|---|---|---|
| Previous Owner | Ellis Ronald S | $192,492 | |
| Previous Owner | Newell Steven | $350,000 |
Source: Public Records
Tax History Compared to Growth
Tax History
| Year | Tax Paid | Tax Assessment Tax Assessment Total Assessment is a certain percentage of the fair market value that is determined by local assessors to be the total taxable value of land and additions on the property. | Land | Improvement |
|---|---|---|---|---|
| 2025 | $2,812 | $117,790 | $49,455 | $68,335 |
| 2024 | $2,812 | $118,816 | $49,455 | $69,361 |
| 2023 | $2,732 | $115,404 | $49,455 | $65,949 |
| 2022 | $1,982 | $98,541 | $43,250 | $55,292 |
| 2021 | $2,576 | $90,975 | $35,690 | $55,285 |
| 2020 | $2,498 | $91,324 | $35,690 | $55,634 |
| 2019 | $2,426 | $85,772 | $31,028 | $54,744 |
| 2018 | $2,356 | $77,646 | $23,783 | $53,863 |
| 2017 | $2,272 | $74,005 | $19,782 | $54,223 |
| 2016 | $2,230 | $73,325 | $17,735 | $55,590 |
| 2015 | $2,218 | $72,925 | $17,231 | $55,694 |
| 2014 | $2,135 | $68,451 | $13,356 | $55,095 |
| 2013 | -- | $63,951 | $9,842 | $54,109 |
Source: Public Records
Map
Nearby Homes
- 14505 Geronimo Trail
- 15075 Western Springs Ct
- 645 Paso Fino Ct
- 280 Pisces Cir
- 590 Secretariat Ct Unit 5
- 530 Alydar Ct
- 597 Connemaras Ct
- 0 Kenneth Way Unit 230006476
- 14690 Rancheros Dr
- 14490 Rancheros Dr
- 16260 Rhyolite Cir
- 490 Miesque Ct Unit 6
- 255 Zircon Dr
- 2982 Saddle Peak Dr
- 2904 Amethyst Hills Dr
- 2944 Ruby Desert Dr
- 13820 Virginia Foothills Dr
- 11325 Messina Ct
- 2964 Ruby Desert Dr
- 3036 Feathertop Dr
- 1270 High Chaparral Dr
- 1270 High Chaparral Dr Unit Drive
- 1250 High Chaparral Dr
- 1280 High Chaparral Dr
- 1240 High Chaparral Dr
- 1265 High Chaparral Dr
- 1275 High Chaparral Dr Unit 3B
- 1230 High Chaparral Dr
- 1255 High Chaparral Dr
- 1295 High Chaparral Dr
- 14495 Shadow Hills Dr
- 1235 High Chaparral Dr
- 1220 High Chaparral Dr
- 14475 Shadow Hills Dr
- 1213 Crawford Creek Ct
- 1207 Crawford Creek Ct
- 1219 Crawford Creek Ct
- 1225 High Chaparral Dr
- 14500 Shadow Hills Dr
- 14465 Shadow Hills Dr