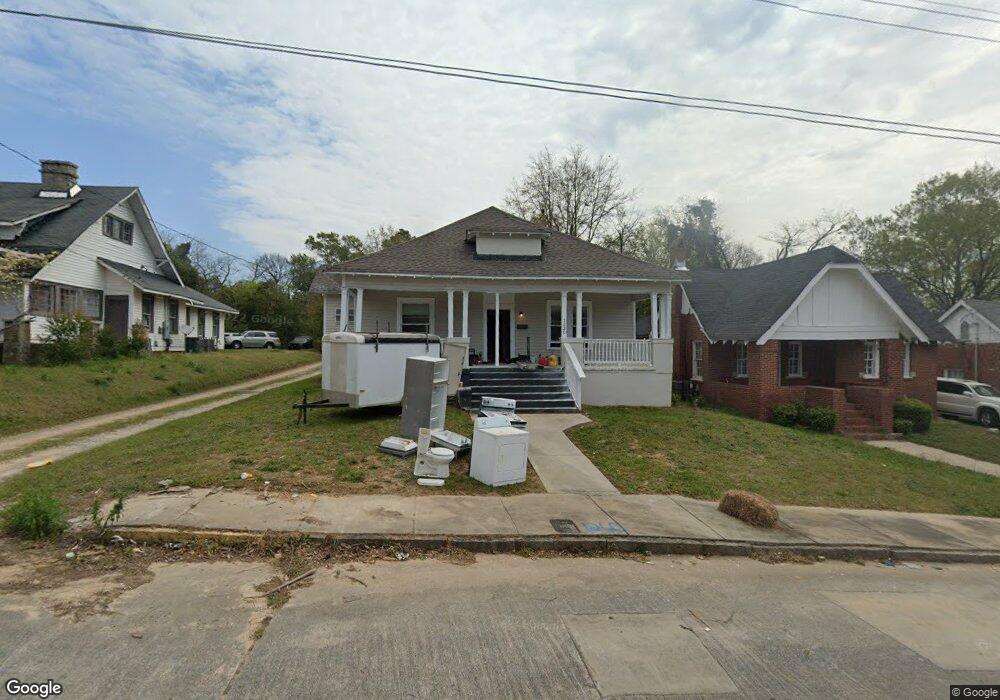
1260 Hillyer Ave Macon, GA 31204
Napier Heights Historic District NeighborhoodEstimated Value: $54,780 - $159,000
3
Beds
1
Bath
1,746
Sq Ft
$57/Sq Ft
Est. Value
About This Home
This home is located at 1260 Hillyer Ave, Macon, GA 31204 and is currently estimated at $98,945, approximately $56 per square foot. 1260 Hillyer Ave is a home located in Bibb County with nearby schools including Brookdale Elementary School, Miller Fine Arts Magnet Middle School, and Central High School.
Ownership History
Date
Name
Owned For
Owner Type
Purchase Details
Closed on
Jun 8, 2021
Sold by
Keyglee Atl Llc
Bought by
Given Not
Current Estimated Value
Home Financials for this Owner
Home Financials are based on the most recent Mortgage that was taken out on this home.
Original Mortgage
$29,974
Interest Rate
3.1%
Mortgage Type
Construction
Purchase Details
Closed on
Apr 15, 2021
Sold by
Woods Foundations Llc
Bought by
Sharpstone Properties Llc
Home Financials for this Owner
Home Financials are based on the most recent Mortgage that was taken out on this home.
Original Mortgage
$29,974
Interest Rate
3.1%
Mortgage Type
Construction
Purchase Details
Closed on
Oct 4, 2019
Sold by
Barron Property Group Llc
Bought by
Woods Foundations Llc
Purchase Details
Closed on
Aug 2, 2019
Sold by
Ferguson Gwendolyn
Bought by
Property Group Llc
Purchase Details
Closed on
Mar 31, 1989
Sold by
Gray Mary Lou D By Extr
Bought by
Ferguson Gwendolyn
Create a Home Valuation Report for This Property
The Home Valuation Report is an in-depth analysis detailing your home's value as well as a comparison with similar homes in the area
Home Values in the Area
Average Home Value in this Area
Purchase History
| Date | Buyer | Sale Price | Title Company |
|---|---|---|---|
| Sharpstone Properties Llc | $20,000 | None Listed On Document | |
| Woods Foundations Llc | $12,900 | None Available | |
| Property Group Llc | $5,000 | None Available | |
| Ferguson Gwendolyn | $33,000 | -- | |
| Given Not | -- | None Listed On Document |
Source: Public Records
Mortgage History
| Date | Status | Borrower | Loan Amount |
|---|---|---|---|
| Previous Owner | Sharpstone Properties Llc | $29,974 |
Source: Public Records
Tax History Compared to Growth
Tax History
| Year | Tax Paid | Tax Assessment Tax Assessment Total Assessment is a certain percentage of the fair market value that is determined by local assessors to be the total taxable value of land and additions on the property. | Land | Improvement |
|---|---|---|---|---|
| 2025 | $589 | $23,972 | $2,760 | $21,212 |
| 2024 | $609 | $23,972 | $2,760 | $21,212 |
| 2023 | $643 | $21,706 | $1,660 | $20,046 |
| 2022 | $429 | $12,382 | $2,211 | $10,171 |
| 2021 | $443 | $11,658 | $2,211 | $9,447 |
| 2020 | $426 | $10,970 | $2,211 | $8,759 |
| 2019 | $607 | $15,516 | $2,457 | $13,059 |
| 2018 | $1,162 | $16,373 | $2,457 | $13,916 |
| 2017 | $613 | $16,373 | $2,457 | $13,916 |
| 2016 | $735 | $21,243 | $2,457 | $18,786 |
| 2015 | $1,040 | $21,243 | $2,457 | $18,786 |
| 2014 | $1,196 | $21,243 | $2,457 | $18,786 |
Source: Public Records
Map
Nearby Homes
- 1340 Courtland Ave
- 1285 Pio Nono Ave
- 1148 Hillyer Ave
- 2686 Napier Ave
- 1198 Winton Ave
- 2773 Beech Ave
- 2534 Napier Ave
- 1198 Brentwood Ave
- 1518 Marigold Ave
- 2485 Beech Ave
- 1195 Brentwood Ave
- 1171 Brentwood Ave
- 2497 Napier Ave
- 1485 Brentwood Ave
- 1568 Marigold Ave
- 2435 Napier Ave
- 1580 Marigold Ave
- 1495 Ninadel Dr
- 297 Pansy Ave
- 254 Lilly Ave
- 1272 Hillyer Ave
- 1250 Hillyer Ave
- 1284 Hillyer Ave
- 1236 Hillyer Ave
- 1296 Hillyer Ave
- 1212 Hillyer Ave
- 1261 Courtland Ave
- 1243 Courtland Ave
- 1277 Courtland Ave
- 1261 Hillyer Ave
- 1273 Hillyer Ave
- 1297 Hillyer Ave
- 1312 Hillyer Ave
- 1231 Courtland Ave
- 1249 Hillyer Ave
- 1285 Hillyer Ave
- 1293 Courtland Ave Unit 1A
- 0 Date Ave
- 1221 Hillyer Ave
- 1217 Courtland Ave