1260 Oakfield Dr N Columbus, OH 43229
Devonshire NeighborhoodEstimated Value: $269,000 - $292,000
4
Beds
2
Baths
1,480
Sq Ft
$189/Sq Ft
Est. Value
About This Home
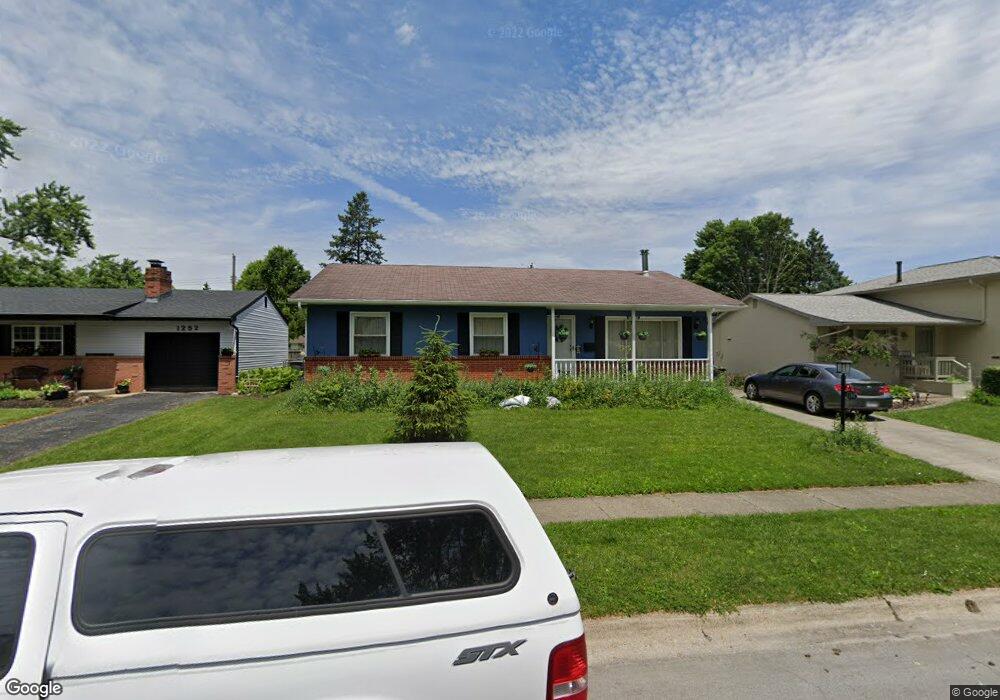
This home is located at 1260 Oakfield Dr N, Columbus, OH 43229 and is currently estimated at $279,498, approximately $188 per square foot. 1260 Oakfield Dr N is a home located in Franklin County with nearby schools including Devonshire Alternative Elementary School, Woodward Park Middle School, and Beechcroft High School.
Ownership History
Date
Name
Owned For
Owner Type
Purchase Details
Closed on
Nov 21, 2003
Sold by
Mcgraw Andy and Mcgraw Maria
Bought by
Delbene Pamela Jane
Current Estimated Value
Home Financials for this Owner
Home Financials are based on the most recent Mortgage that was taken out on this home.
Original Mortgage
$129,437
Outstanding Balance
$60,049
Interest Rate
6.01%
Mortgage Type
Stand Alone First
Estimated Equity
$219,449
Purchase Details
Closed on
Oct 14, 2002
Sold by
Hud
Bought by
Mcgraw Andy and Mcgraw Maria
Home Financials for this Owner
Home Financials are based on the most recent Mortgage that was taken out on this home.
Original Mortgage
$89,550
Interest Rate
6.18%
Purchase Details
Closed on
Feb 21, 2002
Sold by
Nagy Daniel A and Wells Fargo Home Mtg Inc
Bought by
Hud
Purchase Details
Closed on
Nov 23, 1993
Purchase Details
Closed on
Dec 5, 1989
Create a Home Valuation Report for This Property
The Home Valuation Report is an in-depth analysis detailing your home's value as well as a comparison with similar homes in the area
Home Values in the Area
Average Home Value in this Area
Purchase History
| Date | Buyer | Sale Price | Title Company |
|---|---|---|---|
| Delbene Pamela Jane | $136,300 | Contract Processing & Title | |
| Mcgraw Andy | $99,500 | Contract Processing & Title | |
| Hud | $85,000 | -- | |
| -- | $87,500 | -- | |
| -- | $74,000 | -- |
Source: Public Records
Mortgage History
| Date | Status | Borrower | Loan Amount |
|---|---|---|---|
| Open | Delbene Pamela Jane | $129,437 | |
| Previous Owner | Mcgraw Andy | $89,550 |
Source: Public Records
Tax History Compared to Growth
Tax History
| Year | Tax Paid | Tax Assessment Tax Assessment Total Assessment is a certain percentage of the fair market value that is determined by local assessors to be the total taxable value of land and additions on the property. | Land | Improvement |
|---|---|---|---|---|
| 2024 | $3,666 | $81,690 | $17,500 | $64,190 |
| 2023 | $3,619 | $81,690 | $17,500 | $64,190 |
| 2022 | $2,660 | $51,280 | $12,600 | $38,680 |
| 2021 | $2,664 | $51,280 | $12,600 | $38,680 |
| 2020 | $2,668 | $51,280 | $12,600 | $38,680 |
| 2019 | $2,495 | $41,130 | $10,080 | $31,050 |
| 2018 | $2,344 | $41,130 | $10,080 | $31,050 |
| 2017 | $2,457 | $41,130 | $10,080 | $31,050 |
| 2016 | $2,421 | $36,550 | $7,670 | $28,880 |
| 2015 | $2,198 | $36,550 | $7,670 | $28,880 |
| 2014 | $2,203 | $36,550 | $7,670 | $28,880 |
| 2013 | $1,207 | $40,600 | $8,505 | $32,095 |
Source: Public Records
Map
Nearby Homes
- 1288 Oakfield Dr N
- 6189 Northgap Dr
- 6211 Parkdale Dr
- 1171 Newbury Dr
- 5990 Ambleside Dr
- 1268 Kildale Ct
- 1390 E Dublin Granville Rd
- 1549 Alpine Dr
- 6035 Karl Rd
- 6407 Faircrest Rd
- 1409 Bosworth Place
- 1421 Bosworth Place
- 6342 Bellmeadow Dr
- 6458 Faircrest Rd
- 1294 Clydesdale Ct
- 1322 Bolenhill Ct
- 1492 Cottonwood Dr
- 1752 Pine Tree St S Unit H
- 1743 Pine Tree St N Unit A
- 6407 Skywae Dr
- 1268 Oakfield Dr N
- 1276 Oakfield Dr N
- 1244 Oakfield Dr N
- 6227 Ambleside Dr
- 6225 Ambleside Dr
- 1257 Oakfield Dr N
- 6223 Ambleside Dr
- 1265 Oakfield Dr N
- 1236 Oakfield Dr N
- 1282 Oakfield Dr N
- 1249 Oakfield Dr N
- 1273 Oakfield Dr N
- 1241 Oakfield Dr N
- 6221 Ambleside Dr
- 1228 Oakfield Dr N
- 6220 Northgap Dr
- 6157 Oakfield Dr E
- 6216 Northgap Dr
- 6231 Ambleside Dr
- 6210 Northgap Dr