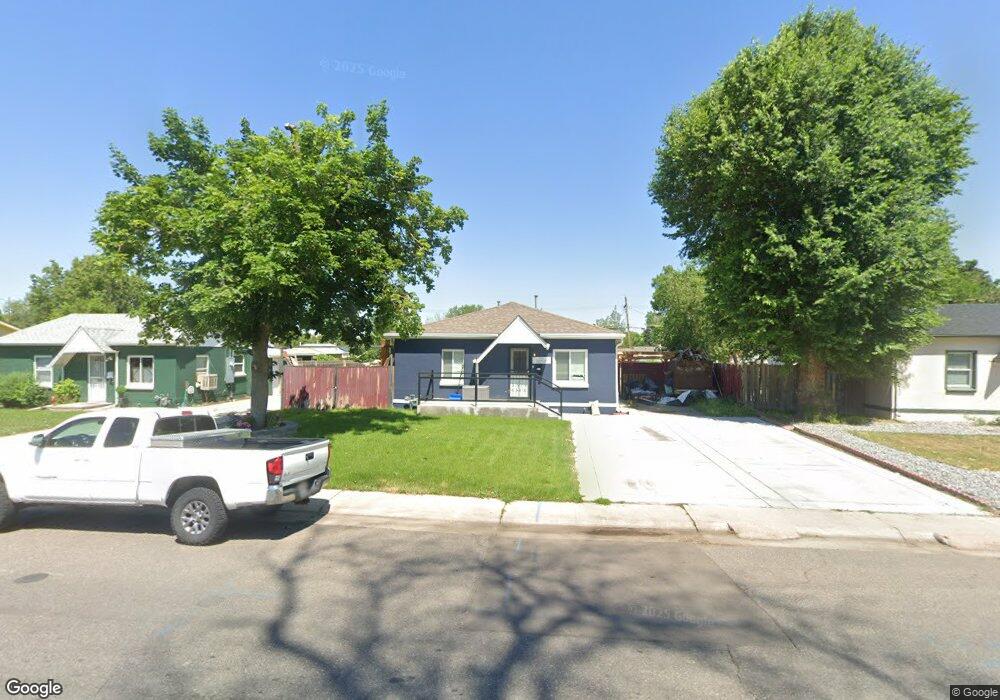
1260 S Tennyson St Denver, CO 80219
Mar Lee NeighborhoodEstimated Value: $316,946 - $390,000
2
Beds
1
Bath
672
Sq Ft
$536/Sq Ft
Est. Value
About This Home
This home is located at 1260 S Tennyson St, Denver, CO 80219 and is currently estimated at $359,987, approximately $535 per square foot. 1260 S Tennyson St is a home located in Denver County with nearby schools including Force Elementary School, Kepner Beacon Middle School, and John F Kennedy High School.
Ownership History
Date
Name
Owned For
Owner Type
Purchase Details
Closed on
Apr 19, 2022
Sold by
Saenz Jose J
Bought by
Saenz Jose J and Saenz Hilda
Current Estimated Value
Home Financials for this Owner
Home Financials are based on the most recent Mortgage that was taken out on this home.
Original Mortgage
$294,566
Outstanding Balance
$278,777
Interest Rate
5%
Mortgage Type
FHA
Estimated Equity
$81,210
Purchase Details
Closed on
May 29, 2001
Sold by
Becerra Carlos G
Bought by
Saenz Jose J
Home Financials for this Owner
Home Financials are based on the most recent Mortgage that was taken out on this home.
Original Mortgage
$123,500
Interest Rate
7.1%
Purchase Details
Closed on
Nov 15, 1996
Sold by
Ann Cressler Judith
Bought by
Becerra Carlos G and Becerra Veronica S
Home Financials for this Owner
Home Financials are based on the most recent Mortgage that was taken out on this home.
Original Mortgage
$74,386
Interest Rate
7.84%
Mortgage Type
FHA
Create a Home Valuation Report for This Property
The Home Valuation Report is an in-depth analysis detailing your home's value as well as a comparison with similar homes in the area
Home Values in the Area
Average Home Value in this Area
Purchase History
| Date | Buyer | Sale Price | Title Company |
|---|---|---|---|
| Saenz Jose J | $300,000 | First American Title | |
| Saenz Jose J | $130,000 | -- | |
| Becerra Carlos G | $75,000 | Land Title |
Source: Public Records
Mortgage History
| Date | Status | Borrower | Loan Amount |
|---|---|---|---|
| Open | Saenz Jose J | $294,566 | |
| Previous Owner | Saenz Jose J | $123,500 | |
| Previous Owner | Becerra Carlos G | $74,386 |
Source: Public Records
Tax History Compared to Growth
Tax History
| Year | Tax Paid | Tax Assessment Tax Assessment Total Assessment is a certain percentage of the fair market value that is determined by local assessors to be the total taxable value of land and additions on the property. | Land | Improvement |
|---|---|---|---|---|
| 2024 | $1,660 | $20,960 | $2,060 | $18,900 |
| 2023 | $1,624 | $20,960 | $2,060 | $18,900 |
| 2022 | $1,575 | $19,800 | $5,960 | $13,840 |
| 2021 | $1,520 | $20,370 | $6,130 | $14,240 |
| 2020 | $1,333 | $17,960 | $6,130 | $11,830 |
| 2019 | $1,295 | $17,960 | $6,130 | $11,830 |
| 2018 | $1,020 | $13,180 | $4,630 | $8,550 |
| 2017 | $1,017 | $13,180 | $4,630 | $8,550 |
| 2016 | $797 | $9,770 | $4,832 | $4,938 |
| 2015 | $763 | $9,770 | $4,832 | $4,938 |
| 2014 | $617 | $7,430 | $2,842 | $4,588 |
Source: Public Records
Map
Nearby Homes
- 1255 S Patton Ct
- 1361 S Perry St
- 1110 S Quitman St
- 1381 S Perry St
- 1200 S Patton Ct
- 1124 S Perry St
- 1075 S Raleigh St
- 1135 S Vrain St
- 1050 S Quitman St
- 1455 S Tennyson St
- 4445 W Tennessee Ave
- 1470 S Quitman St
- 1057 S Osceola St
- 1470 S Winona Way
- 419 S Osceola St
- 415 S Osceola St
- 405 S Osceola St
- 1532 S Quitman St
- 364 S Newton St
- 990 S Meade St
- 1250 S Tennyson St
- 1270 S Tennyson St
- 1240 S Tennyson St
- 1280 S Tennyson St
- 1280 S Tennyson St Unit 4
- 1280 S Tennyson St Unit 5
- 1280 S Tennyson St Unit 2
- 1280 S Tennyson St Unit 1
- 1255 S Tennyson St
- 1265 S Tennyson St
- 1230 S Tennyson St
- 1285 S Tennyson St
- 1290 S Tennyson St
- 1265 S Raleigh St
- 1275 S Raleigh St
- 1255 S Raleigh St
- 1285 S Raleigh St
- 1235 S Tennyson St
- 1245 S Raleigh St
- 1295 S Tennyson St