Estimated Value: $299,000 - $344,888
3
Beds
3
Baths
2,038
Sq Ft
$162/Sq Ft
Est. Value
About This Home
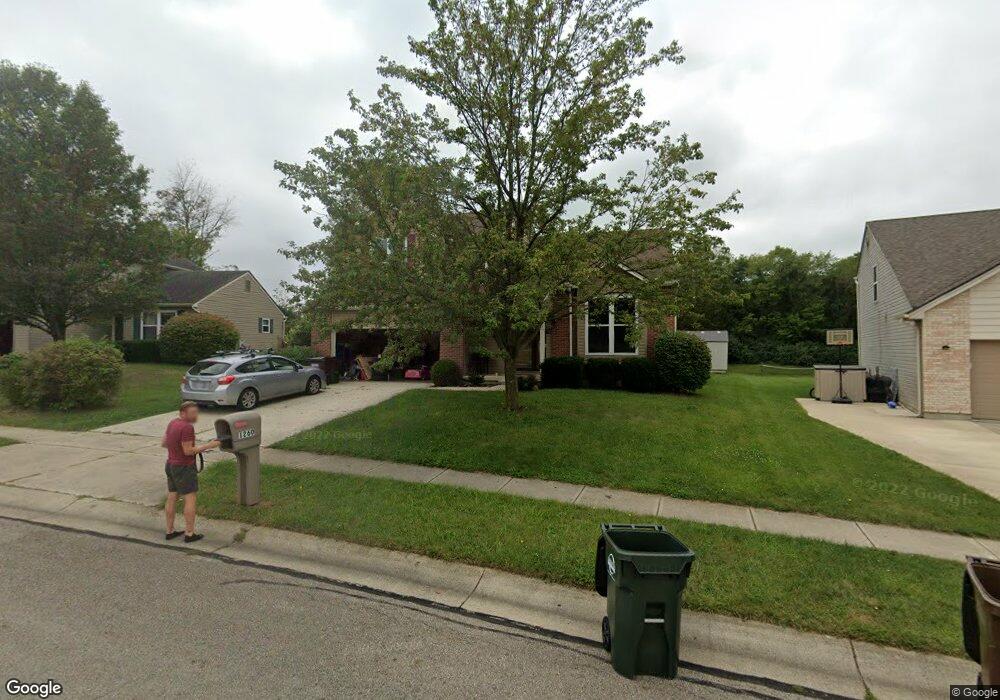
This home is located at 1260 Shannon Ln, Xenia, OH 45385 and is currently estimated at $330,472, approximately $162 per square foot. 1260 Shannon Ln is a home located in Greene County with nearby schools including Xenia High School and Summit Academy Community School for Alternative Learners - Xenia.
Ownership History
Date
Name
Owned For
Owner Type
Purchase Details
Closed on
May 19, 2020
Sold by
Price Brent E and Price Jean M
Bought by
Johnston Rita M
Current Estimated Value
Purchase Details
Closed on
Jan 8, 2008
Sold by
Va
Bought by
Price Brent E and Price Jean M
Purchase Details
Closed on
Jun 18, 2007
Sold by
Bryce Charles T and Bryce Rose M
Bought by
Va
Purchase Details
Closed on
Mar 8, 2002
Sold by
Crossmann Communities Of Ohio Inc
Bought by
Bryce Charles T and Bryce Rose M
Home Financials for this Owner
Home Financials are based on the most recent Mortgage that was taken out on this home.
Original Mortgage
$184,161
Interest Rate
7.16%
Mortgage Type
VA
Create a Home Valuation Report for This Property
The Home Valuation Report is an in-depth analysis detailing your home's value as well as a comparison with similar homes in the area
Home Values in the Area
Average Home Value in this Area
Purchase History
| Date | Buyer | Sale Price | Title Company |
|---|---|---|---|
| Johnston Rita M | $215,000 | None Available | |
| Price Brent E | -- | None Available | |
| Va | $156,431 | None Available | |
| Bryce Charles T | $180,600 | -- |
Source: Public Records
Mortgage History
| Date | Status | Borrower | Loan Amount |
|---|---|---|---|
| Previous Owner | Bryce Charles T | $184,161 |
Source: Public Records
Tax History Compared to Growth
Tax History
| Year | Tax Paid | Tax Assessment Tax Assessment Total Assessment is a certain percentage of the fair market value that is determined by local assessors to be the total taxable value of land and additions on the property. | Land | Improvement |
|---|---|---|---|---|
| 2024 | $4,056 | $97,280 | $25,030 | $72,250 |
| 2023 | $4,056 | $97,280 | $25,030 | $72,250 |
| 2022 | $3,563 | $72,850 | $16,680 | $56,170 |
| 2021 | $3,611 | $70,130 | $16,680 | $53,450 |
| 2020 | $3,416 | $70,130 | $16,680 | $53,450 |
| 2019 | $2,826 | $54,610 | $10,790 | $43,820 |
| 2018 | $2,837 | $54,610 | $10,790 | $43,820 |
| 2017 | $2,780 | $54,610 | $10,790 | $43,820 |
| 2016 | $2,781 | $52,530 | $10,790 | $41,740 |
| 2015 | $2,261 | $52,530 | $10,790 | $41,740 |
| 2014 | $1,335 | $52,530 | $10,790 | $41,740 |
Source: Public Records
Map
Nearby Homes
- 1282 Baybury Ave
- 1298 Baybury Ave
- 1304 Baybury Ave
- 1318 Prem Place
- 1293 Baybury Ave
- 1248 Prem Place
- 1272 Baybury Ave
- 1292 Baybury Ave
- 1161 Shannon Ln
- 1213 Prem Place
- 2705 Tennessee Dr
- 1474 Hawkshead St
- Chatham Plan at Edenbridge
- Bellamy Plan at Edenbridge
- Holcombe Plan at Edenbridge
- Henley Plan at Edenbridge
- Newcastle Plan at Edenbridge
- 2821 Raxit Ct
- 2692 Kingman Dr
- 2784 Greystoke Dr
- 1223 Shannon Ln
- 1217 Shannon Ln
- 1250 Shannon Ln
- 1270 Shannon Ln
- 1231 Shannon Ln
- 1215 Shannon Ln
- 1242 Shannon Ln
- 1278 Shannon Ln
- 1253 Shannon Ln
- 1286 Shannon Ln
- 1236 Shannon Ln
- 1241 Shannon Ln
- 1283 Shannon Ln
- 1235 Shannon Ln
- 1230 Shannon Ln
- 1294 Shannon Ln
- 3026 W Barnhill Place
- 1291 Shannon Ln
- 3015 W Barnhill Place
- 1302 Shannon Ln