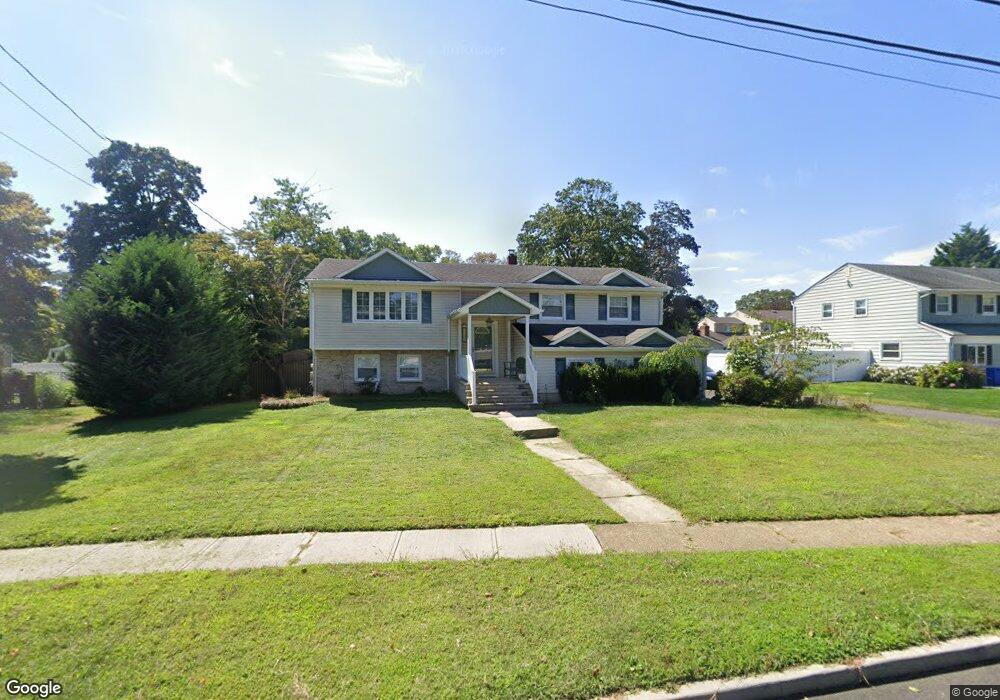
1260 Turf Dr Oceanport, NJ 07757
Estimated Value: $737,133 - $980,000
3
Beds
2
Baths
2,117
Sq Ft
$402/Sq Ft
Est. Value
About This Home
This home is located at 1260 Turf Dr, Oceanport, NJ 07757 and is currently estimated at $852,033, approximately $402 per square foot. 1260 Turf Dr is a home located in Monmouth County with nearby schools including Wolf Hill Elementary School, Maple Place Elementary and Middle School, and Shore Regional High School.
Ownership History
Date
Name
Owned For
Owner Type
Purchase Details
Closed on
Feb 9, 2024
Sold by
Landrigan Kevin F
Bought by
Landrigan Sean and Landrigan Brian
Current Estimated Value
Purchase Details
Closed on
Jul 30, 1999
Sold by
Abbate John
Bought by
Landrigan Kevin and Landrigan Linda
Home Financials for this Owner
Home Financials are based on the most recent Mortgage that was taken out on this home.
Original Mortgage
$153,000
Interest Rate
7.86%
Create a Home Valuation Report for This Property
The Home Valuation Report is an in-depth analysis detailing your home's value as well as a comparison with similar homes in the area
Home Values in the Area
Average Home Value in this Area
Purchase History
| Date | Buyer | Sale Price | Title Company |
|---|---|---|---|
| Landrigan Sean | -- | None Listed On Document | |
| Landrigan Sean | -- | None Listed On Document | |
| Landrigan Kevin | $234,000 | -- | |
| Landrigan Kevin | $234,000 | -- |
Source: Public Records
Mortgage History
| Date | Status | Borrower | Loan Amount |
|---|---|---|---|
| Previous Owner | Landrigan Kevin | $153,000 |
Source: Public Records
Tax History Compared to Growth
Tax History
| Year | Tax Paid | Tax Assessment Tax Assessment Total Assessment is a certain percentage of the fair market value that is determined by local assessors to be the total taxable value of land and additions on the property. | Land | Improvement |
|---|---|---|---|---|
| 2025 | $8,366 | $561,300 | $341,700 | $219,600 |
| 2024 | $7,976 | $529,800 | $319,700 | $210,100 |
| 2023 | $7,976 | $479,300 | $279,700 | $199,600 |
| 2022 | $7,502 | $435,400 | $259,700 | $175,700 |
| 2021 | $7,502 | $416,800 | $249,700 | $167,100 |
| 2020 | $7,422 | $406,000 | $241,700 | $164,300 |
| 2019 | $7,028 | $390,200 | $231,700 | $158,500 |
| 2018 | $6,888 | $385,000 | $231,700 | $153,300 |
| 2017 | $6,355 | $294,600 | $154,500 | $140,100 |
| 2016 | $6,384 | $297,900 | $160,500 | $137,400 |
| 2015 | $6,143 | $296,200 | $165,500 | $130,700 |
| 2014 | $7,370 | $360,400 | $180,500 | $179,900 |
Source: Public Records
Map
Nearby Homes