1260 W 3000 S Victor, ID 83455
Estimated Value: $814,699 - $1,312,000
4
Beds
4
Baths
2,756
Sq Ft
$381/Sq Ft
Est. Value
About This Home
This home is located at 1260 W 3000 S, Victor, ID 83455 and is currently estimated at $1,049,425, approximately $380 per square foot. 1260 W 3000 S is a home located in Teton County with nearby schools including Driggs Elementary School, Teton High School, and The Learning Academy of Teton Valley.
Ownership History
Date
Name
Owned For
Owner Type
Purchase Details
Closed on
Jan 12, 2022
Sold by
Hillman Craig D
Bought by
Hillman Craig D and Hillman Lori A
Current Estimated Value
Purchase Details
Closed on
Sep 1, 2021
Sold by
Hiliman Craig D and Hiliman Lori A
Bought by
Hiliman Craig D
Home Financials for this Owner
Home Financials are based on the most recent Mortgage that was taken out on this home.
Original Mortgage
$297,400
Interest Rate
2.87%
Create a Home Valuation Report for This Property
The Home Valuation Report is an in-depth analysis detailing your home's value as well as a comparison with similar homes in the area
Home Values in the Area
Average Home Value in this Area
Purchase History
| Date | Buyer | Sale Price | Title Company |
|---|---|---|---|
| Hillman Craig D | -- | First American Title | |
| Hiliman Craig D | -- | First American Ttl Ins Compa |
Source: Public Records
Mortgage History
| Date | Status | Borrower | Loan Amount |
|---|---|---|---|
| Previous Owner | Hiliman Craig D | $297,400 |
Source: Public Records
Tax History Compared to Growth
Tax History
| Year | Tax Paid | Tax Assessment Tax Assessment Total Assessment is a certain percentage of the fair market value that is determined by local assessors to be the total taxable value of land and additions on the property. | Land | Improvement |
|---|---|---|---|---|
| 2025 | $1,675 | $655,705 | $77,304 | $578,401 |
| 2024 | $1,675 | $640,721 | $62,320 | $578,401 |
| 2023 | $1,675 | $640,787 | $62,312 | $578,475 |
| 2022 | $1,774 | $540,214 | $36,976 | $503,238 |
| 2021 | $1,735 | $373,742 | $26,656 | $347,086 |
| 2020 | $1,775 | $308,366 | $26,580 | $281,786 |
| 2019 | $1,737 | $308,310 | $26,524 | $281,786 |
| 2018 | $1,637 | $280,664 | $26,239 | $254,425 |
| 2017 | $1,439 | $275,626 | $21,201 | $254,425 |
| 2016 | $1,352 | $245,986 | $21,151 | $224,835 |
| 2015 | $1,294 | $216,343 | $21,098 | $195,245 |
| 2011 | -- | $215,651 | $21,052 | $194,599 |
Source: Public Records
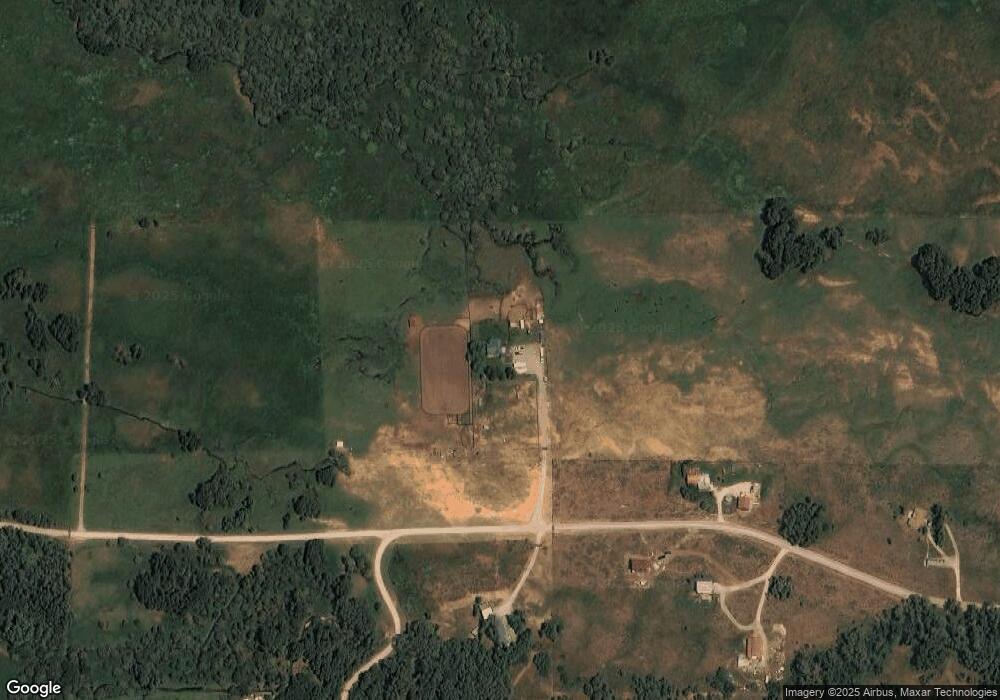
Map
Nearby Homes