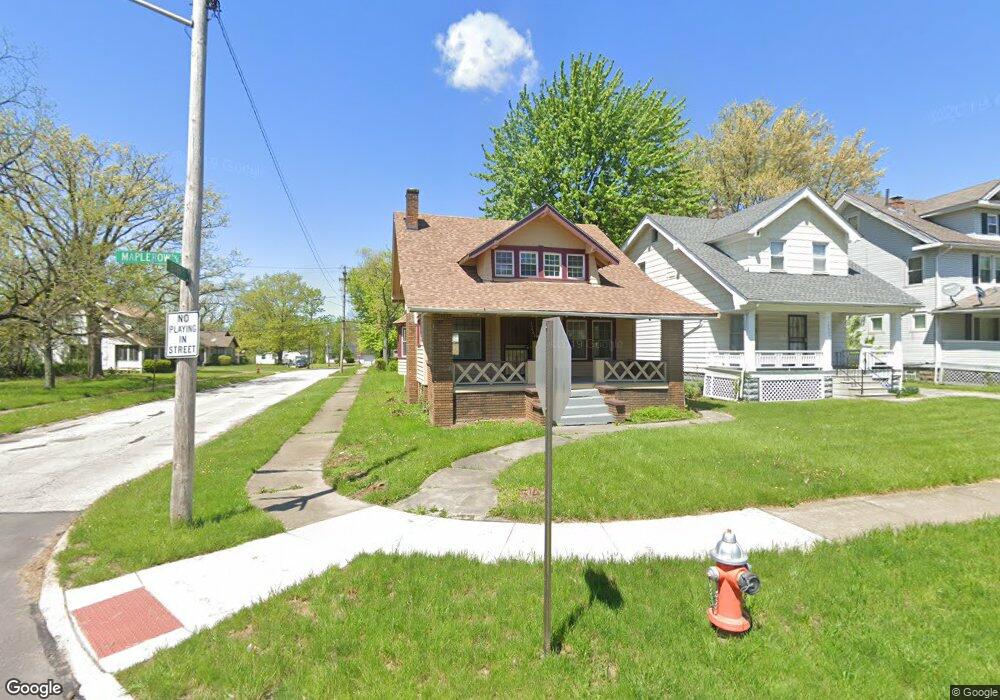
12603 Maplerow Ave Garfield Heights, OH 44105
Estimated Value: $82,000 - $135,000
3
Beds
1
Bath
1,626
Sq Ft
$65/Sq Ft
Est. Value
About This Home
This home is located at 12603 Maplerow Ave, Garfield Heights, OH 44105 and is currently estimated at $104,986, approximately $64 per square foot. 12603 Maplerow Ave is a home located in Cuyahoga County with nearby schools including Andrew J. Rickoff School, Adlai Stevenson School, and Anton Grdina School.
Ownership History
Date
Name
Owned For
Owner Type
Purchase Details
Closed on
Nov 15, 2018
Sold by
Johnson Willie D
Bought by
Singletary Kevin
Current Estimated Value
Purchase Details
Closed on
Nov 2, 2000
Sold by
Carpenter Rene
Bought by
Johnson Willie D
Home Financials for this Owner
Home Financials are based on the most recent Mortgage that was taken out on this home.
Original Mortgage
$75,378
Interest Rate
7.91%
Purchase Details
Closed on
Mar 31, 1998
Sold by
Sec Of Housing Urban Dev
Bought by
Carpenter Rene
Purchase Details
Closed on
Nov 18, 1993
Bought by
Washington Deborah
Purchase Details
Closed on
Jun 6, 1984
Bought by
Washington Harry A
Purchase Details
Closed on
Jul 19, 1978
Bought by
Federal Natl Mortg Assoc
Purchase Details
Closed on
Jul 17, 1978
Sold by
Mccary Pearl C
Bought by
Secretary Of Hud
Purchase Details
Closed on
Jan 1, 1975
Bought by
Mccary Pearl C
Create a Home Valuation Report for This Property
The Home Valuation Report is an in-depth analysis detailing your home's value as well as a comparison with similar homes in the area
Home Values in the Area
Average Home Value in this Area
Purchase History
| Date | Buyer | Sale Price | Title Company |
|---|---|---|---|
| Singletary Kevin | $52,900 | None Available | |
| Johnson Willie D | $76,000 | Equity Title Agency Inc | |
| Carpenter Rene | -- | Gateway Title Agency Inc | |
| Washington Deborah | -- | -- | |
| Washington Harry A | -- | -- | |
| Federal Natl Mortg Assoc | $14,000 | -- | |
| Secretary Of Hud | -- | -- | |
| Mccary Pearl C | -- | -- |
Source: Public Records
Mortgage History
| Date | Status | Borrower | Loan Amount |
|---|---|---|---|
| Previous Owner | Johnson Willie D | $75,378 |
Source: Public Records
Tax History Compared to Growth
Tax History
| Year | Tax Paid | Tax Assessment Tax Assessment Total Assessment is a certain percentage of the fair market value that is determined by local assessors to be the total taxable value of land and additions on the property. | Land | Improvement |
|---|---|---|---|---|
| 2024 | $2,638 | $28,245 | $6,895 | $21,350 |
| 2023 | $1,998 | $18,870 | $3,750 | $15,120 |
| 2022 | $1,964 | $18,865 | $3,745 | $15,120 |
| 2021 | $1,962 | $18,870 | $3,750 | $15,120 |
| 2020 | $2,746 | $18,520 | $3,680 | $14,840 |
| 2019 | $2,824 | $52,900 | $10,500 | $42,400 |
| 2018 | $3,909 | $18,520 | $3,680 | $14,840 |
| 2017 | $2,655 | $19,050 | $3,890 | $15,160 |
| 2016 | $4,263 | $19,050 | $3,890 | $15,160 |
| 2015 | $4,091 | $19,050 | $3,890 | $15,160 |
| 2014 | $4,091 | $24,750 | $5,040 | $19,710 |
Source: Public Records
Map
Nearby Homes
- 12901 Maplerow Ave
- 12711 Melgrove Ave
- 13208 Maplerow Ave
- 12604 Beachwood Ave
- 13212 Maplerow Ave
- 13211 Christine Ave
- 13315 Thornhurst Ave
- 4292 E 128th St
- 4302 E 131st St
- 13604 Maplerow Ave
- 13501 Saybrook Ave
- 4257 E 124th St
- 4286 E 133rd St
- 4239 E 128th St
- 13625 Cranwood Dr
- 4226 E 128th St
- 13624 North Dr
- 13613 Beachwood Ave
- 4313 E 116th St
- 13804 Rexwood Ave
- 12605 Maplerow Ave
- 12611 Maplerow Ave
- 12525 Maplerow Ave
- 12615 Maplerow Ave
- 12513 Maplerow Ave
- 12617 Maplerow Ave
- 12511 Maplerow Ave
- 12606 Thornhurst Ave
- 12600 Maplerow Ave
- 12701 Maplerow Ave
- 12604 Maplerow Ave
- 12610 Thornhurst Ave
- 12610 Maplerow Ave
- 12518 Maplerow Ave
- 12514 Thornhurst Ave
- 12612 Maplerow Ave
- 12514 Maplerow Ave
- 12614 Thornhurst Ave
- 12705 Maplerow Ave
- 12616 Maplerow Ave